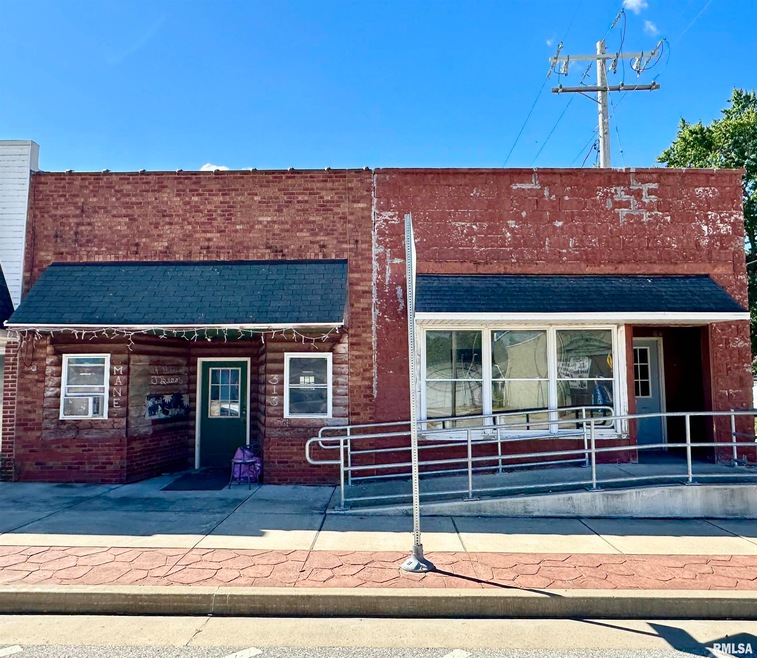
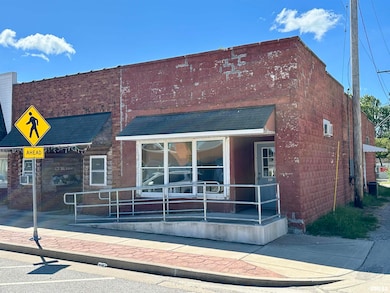
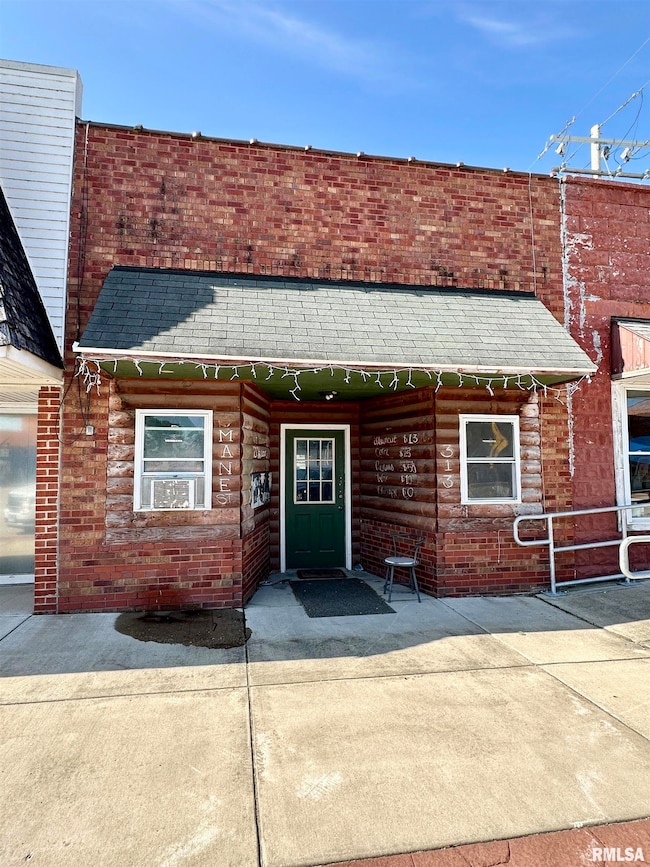
311 & 313 Main St Meredosia, IL 62665
Estimated payment $487/month
Highlights
- 8 Car Detached Garage
- Baseboard Heating
- Level Lot
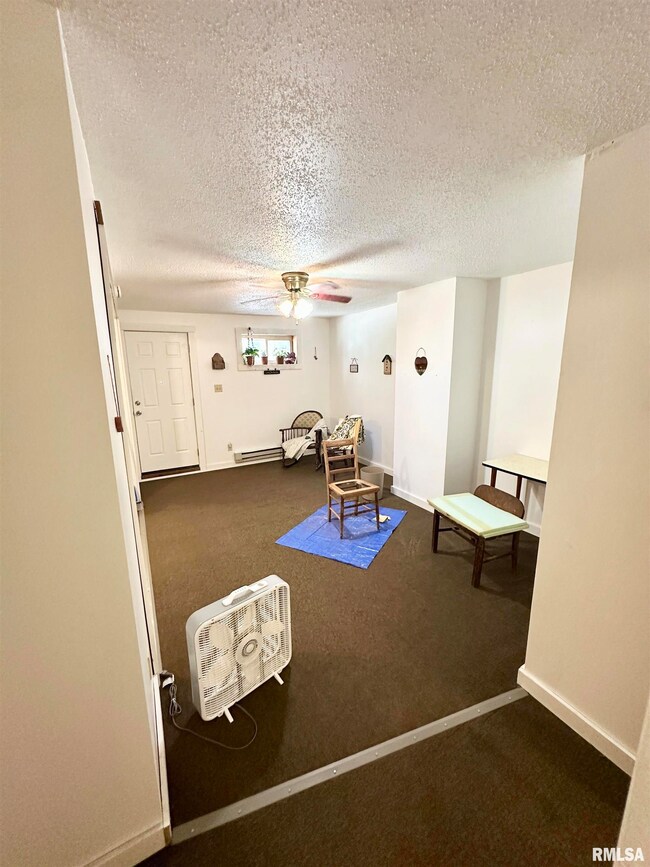
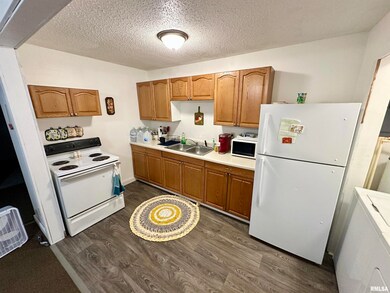
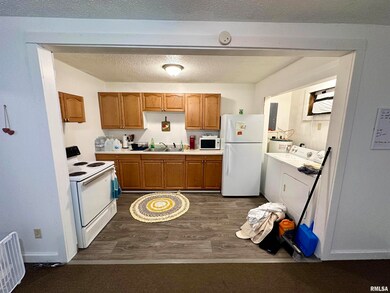
About This Home
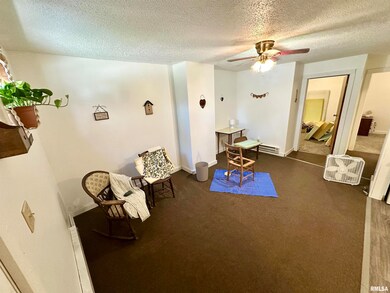
Unique investment opportunity. 2 buildings. 311 is currently vacant but could be finished for a 4th rental unit. 311 1/2 is a 2BR/1BA apartment rented at $440/month. 313 is currently rented and operating as a hair salon at $350/month. 313 1/2 is a second 2BR, 1BA apartment rented at $550/month. This unit has had several nice recent upgrades. All electric. Landlord pays water/sewer. This is a great opportunity to start your investment journey or for the current investors, here's a money maker to add to your existing portfolio.
Property Details
Home Type
- Multi-Family
Est. Annual Taxes
- $1,412
Year Built
- Built in 1962
Lot Details
- Lot Dimensions are 40 x 120
- Level Lot
Home Design
- 3,100 Sq Ft Home
- Brick Exterior Construction
- Composition Roof
Bedrooms and Bathrooms
- 4 Bedrooms
Basement
- Basement Cellar
- Crawl Space
Parking
- 8 Car Detached Garage
- On-Street Parking
Schools
- Meredosia/Chambersburg Elementary School
- Meredosia - Chambersburg High School
Utilities
- Window Unit Heating System
- Baseboard Heating
- Electric Water Heater
Listing and Financial Details
- Assessor Parcel Number 0122113016
Map
Home Values in the Area
Average Home Value in this Area
Tax History
| Year | Tax Paid | Tax Assessment Tax Assessment Total Assessment is a certain percentage of the fair market value that is determined by local assessors to be the total taxable value of land and additions on the property. | Land | Improvement |
|---|---|---|---|---|
| 2024 | $616 | $6,170 | $670 | $5,500 |
| 2023 | $621 | $6,170 | $670 | $5,500 |
| 2022 | $615 | $6,170 | $670 | $5,500 |
| 2021 | $656 | $6,170 | $670 | $5,500 |
| 2020 | $611 | $6,170 | $670 | $5,500 |
| 2019 | $623 | $6,170 | $670 | $5,500 |
| 2018 | $609 | $6,170 | $670 | $5,500 |
| 2017 | $618 | $6,490 | $700 | $5,790 |
| 2016 | $644 | $6,810 | $700 | $6,110 |
| 2015 | $638 | $6,680 | $690 | $5,990 |
| 2014 | $638 | $6,550 | $680 | $5,870 |
| 2013 | $612 | $6,550 | $680 | $5,870 |
Property History
| Date | Event | Price | List to Sale | Price per Sq Ft |
|---|---|---|---|---|
| 11/10/2025 11/10/25 | Pending | -- | -- | -- |
| 08/26/2025 08/26/25 | Price Changed | $69,900 | -12.5% | $23 / Sq Ft |
| 07/07/2025 07/07/25 | For Sale | $79,900 | -- | $26 / Sq Ft |
Purchase History
| Date | Type | Sale Price | Title Company |
|---|---|---|---|
| Contract Of Sale | -- | None Available | |
| Warranty Deed | $25,500 | None Available |
Mortgage History
| Date | Status | Loan Amount | Loan Type |
|---|---|---|---|
| Closed | $26,139 | Commercial |
Source: RMLS Alliance
MLS Number: CA1037653
APN: 01-22-113-017
Disclaimer: Certain information contained herein is derived from information provided by parties other than Homes.com. All information provided is deemed reliable, but is not guaranteed to be accurate and should be independently verified.
![]() IDX information is provided exclusively for personal, non-commercial use, and may not be used for any purpose other than to identify prospective properties consumers may be interested in purchasing. Information is deemed reliable but not guaranteed.
IDX information is provided exclusively for personal, non-commercial use, and may not be used for any purpose other than to identify prospective properties consumers may be interested in purchasing. Information is deemed reliable but not guaranteed.
