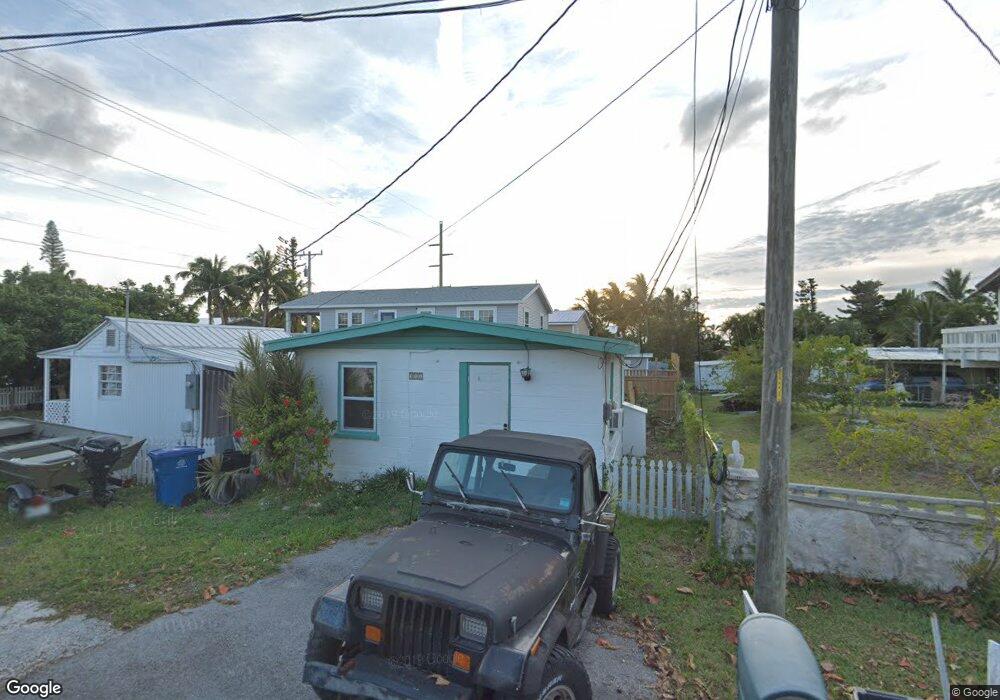
311 3rd St Key West, FL 33040
Estimated Value: $378,000 - $1,025,000
2
Beds
2
Baths
772
Sq Ft
$809/Sq Ft
Est. Value
About This Home
This home is located at 311 3rd St, Key West, FL 33040 and is currently estimated at $624,780, approximately $809 per square foot. 311 3rd St is a home located in Monroe County with nearby schools including Sugarloaf School and Key West High School.
Ownership History
Date
Name
Owned For
Owner Type
Purchase Details
Closed on
Jul 24, 2015
Sold by
Clark Jessica
Bought by
Robert Janicki Rentals Llc
Current Estimated Value
Purchase Details
Closed on
Feb 18, 1998
Sold by
Hollinsed Primrose
Bought by
Clark Jessica
Home Financials for this Owner
Home Financials are based on the most recent Mortgage that was taken out on this home.
Original Mortgage
$135,000
Interest Rate
6.89%
Mortgage Type
Commercial
Purchase Details
Closed on
Dec 11, 1995
Sold by
Skomp A Frederick
Bought by
Hollinsed Petagay and Hollinsend Primrose
Home Financials for this Owner
Home Financials are based on the most recent Mortgage that was taken out on this home.
Original Mortgage
$92,280
Interest Rate
7.4%
Mortgage Type
FHA
Purchase Details
Closed on
Jun 1, 1990
Bought by
Robert Janicki Rentals Llc
Purchase Details
Closed on
May 1, 1980
Bought by
Robert Janicki Rentals Llc
Create a Home Valuation Report for This Property
The Home Valuation Report is an in-depth analysis detailing your home's value as well as a comparison with similar homes in the area
Home Values in the Area
Average Home Value in this Area
Purchase History
| Date | Buyer | Sale Price | Title Company |
|---|---|---|---|
| Robert Janicki Rentals Llc | $215,000 | Attorney | |
| Clark Jessica | $100 | -- | |
| Clark Jessica | $150,000 | -- | |
| Hollinsed Petagay | $95,000 | -- | |
| Robert Janicki Rentals Llc | $60,000 | -- | |
| Robert Janicki Rentals Llc | $5,000 | -- |
Source: Public Records
Mortgage History
| Date | Status | Borrower | Loan Amount |
|---|---|---|---|
| Previous Owner | Hollinsed Petagay | $135,000 | |
| Previous Owner | Hollinsed Petagay | $92,280 |
Source: Public Records
Tax History
| Year | Tax Paid | Tax Assessment Tax Assessment Total Assessment is a certain percentage of the fair market value that is determined by local assessors to be the total taxable value of land and additions on the property. | Land | Improvement |
|---|---|---|---|---|
| 2025 | $4,109 | $335,683 | $250,000 | $85,683 |
| 2024 | $3,483 | $360,464 | $280,000 | $80,464 |
| 2023 | $3,483 | $248,312 | $175,000 | $73,312 |
| 2022 | $3,315 | $236,390 | $162,500 | $73,890 |
| 2021 | $3,139 | $193,955 | $131,250 | $62,705 |
| 2020 | $3,091 | $188,054 | $126,250 | $61,804 |
| 2019 | $3,106 | $189,797 | $127,500 | $62,297 |
| 2018 | $3,238 | $199,797 | $137,500 | $62,297 |
| 2017 | $3,175 | $196,508 | $0 | $0 |
| 2016 | $3,097 | $182,598 | $0 | $0 |
| 2015 | $3,571 | $219,595 | $0 | $0 |
| 2014 | $3,495 | $202,860 | $0 | $0 |
Source: Public Records
Map
Nearby Homes
- 740 Prado Cir
- 206 4th St
- 201 4th St
- 300 Avenue C
- 530 Avenue D Ave
- 307 Avenue B
- 169 Overseas Hwy
- 6 Ed Swift Rd
- 37 Ed Swift Rd
- 813 2nd St
- 55 Ed Swift Rd
- 201 Coppitt Rd Unit 203
- 201 Coppitt Rd Unit 301
- 201 Coppitt Rd Unit 201
- 201 Coppitt Rd Unit 104
- 201 Coppitt Rd Unit 204
- 201 Coppitt Rd Unit 202
- 201 Coppitt Rd Unit 103
- 72&74 Ed Swift Rd
- 24 Cactus Dr
Your Personal Tour Guide
Ask me questions while you tour the home.