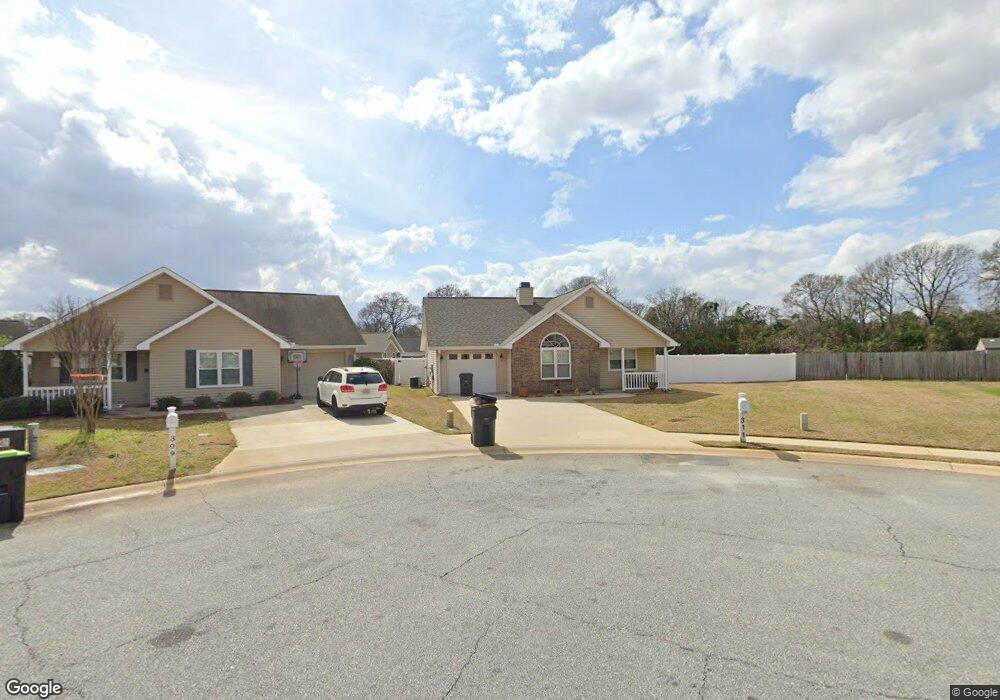
311 Antler Trail Warner Robins, GA 31088
Estimated Value: $219,915 - $228,000
2
Beds
2
Baths
1,326
Sq Ft
$168/Sq Ft
Est. Value
About This Home
This home is located at 311 Antler Trail, Warner Robins, GA 31088 and is currently estimated at $222,979, approximately $168 per square foot. 311 Antler Trail is a home located in Houston County with nearby schools including Quail Run Elementary School, Thomson Middle School, and Northside High School.
Ownership History
Date
Name
Owned For
Owner Type
Purchase Details
Closed on
Dec 14, 2012
Sold by
Bacon Ryan E
Bought by
Jones Randy L and Jones Debra E
Current Estimated Value
Purchase Details
Closed on
Aug 6, 2008
Sold by
Frost Crystal A and Grimstad Curtis S
Bought by
Bacon Ryan E
Home Financials for this Owner
Home Financials are based on the most recent Mortgage that was taken out on this home.
Original Mortgage
$114,475
Interest Rate
6.43%
Mortgage Type
Purchase Money Mortgage
Purchase Details
Closed on
Aug 14, 2007
Sold by
Colony Bank Of Houston County
Bought by
Bry Mel Homes Inc
Home Financials for this Owner
Home Financials are based on the most recent Mortgage that was taken out on this home.
Original Mortgage
$118,550
Interest Rate
6.56%
Mortgage Type
New Conventional
Create a Home Valuation Report for This Property
The Home Valuation Report is an in-depth analysis detailing your home's value as well as a comparison with similar homes in the area
Home Values in the Area
Average Home Value in this Area
Purchase History
| Date | Buyer | Sale Price | Title Company |
|---|---|---|---|
| Jones Randy L | $106,000 | None Available | |
| Bacon Ryan E | $120,500 | None Available | |
| Bry Mel Homes Inc | -- | None Available | |
| Grimstad Curtis S | $118,600 | None Available |
Source: Public Records
Mortgage History
| Date | Status | Borrower | Loan Amount |
|---|---|---|---|
| Previous Owner | Bacon Ryan E | $114,475 | |
| Previous Owner | Grimstad Curtis S | $118,550 |
Source: Public Records
Tax History
| Year | Tax Paid | Tax Assessment Tax Assessment Total Assessment is a certain percentage of the fair market value that is determined by local assessors to be the total taxable value of land and additions on the property. | Land | Improvement |
|---|---|---|---|---|
| 2025 | $1,880 | $84,240 | $8,000 | $76,240 |
| 2024 | $1,983 | $74,280 | $6,600 | $67,680 |
| 2023 | $1,550 | $60,640 | $6,600 | $54,040 |
| 2022 | $963 | $51,040 | $6,600 | $44,440 |
| 2021 | $860 | $46,360 | $6,600 | $39,760 |
| 2020 | $402 | $40,320 | $6,600 | $33,720 |
| 2019 | $724 | $40,320 | $6,600 | $33,720 |
| 2018 | $724 | $40,320 | $6,600 | $33,720 |
| 2017 | $725 | $40,320 | $6,600 | $33,720 |
| 2016 | $734 | $40,680 | $6,600 | $34,080 |
| 2015 | -- | $40,680 | $6,600 | $34,080 |
| 2014 | $406 | $40,680 | $6,600 | $34,080 |
| 2013 | $406 | $40,680 | $6,600 | $34,080 |
Source: Public Records
Map
Nearby Homes
- 208 Antler Trail
- 101 Elk Trail
- 319 Deerfield Cir
- 307 Pheasant Ridge Dr
- 205 Bowen Dr
- 322 Pheasant Ridge Dr
- 407 Smoke Rise Dr
- 511 Pheasant Ridge Dr
- 319 Smithville Church Rd
- 301 Bowen Dr
- 713 Pheasant Ridge Dr
- 100 Briarmoor Dr
- 313 Clayton Scott St
- 311 Clayton Scott St
- 309 Clayton Scott St
- 307 Clayton Scott St
- 305 Clayton Scott St
- 113 Georgetown Blvd
- 312 Davids Place Dr
- 100 Grove Ln
- 309 Antler Trail
- 313 Antler Trail
- 419 Spike Trail
- 417 Spike Trail
- 307 Antler Trail
- 421 Spike Trail
- 415 Spike Trail
- 423 Spike Trail
- 305 Antler Trail
- 312 Antler Trail
- 413 Spike Trail
- 303 Antler Trail
- 425 Spike Trail
- 310 Antler Trail
- 308 Antler Trail
- 427 Spike Trail
- 411 Spike Trail
- 411 411 Spike Trail
- 204 Buck Horn Trail
- 202 Buck Horn Trail
Your Personal Tour Guide
Ask me questions while you tour the home.