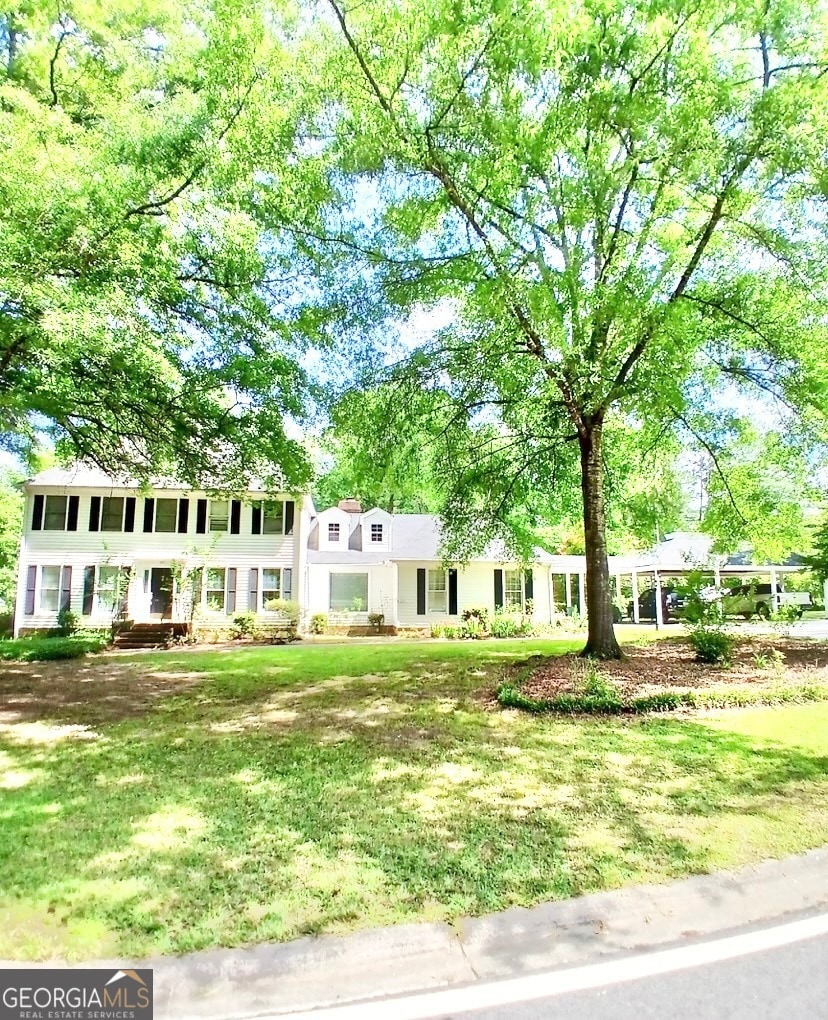
311 Castlegate Rd Macon, GA 31210
Estimated payment $2,038/month
Highlights
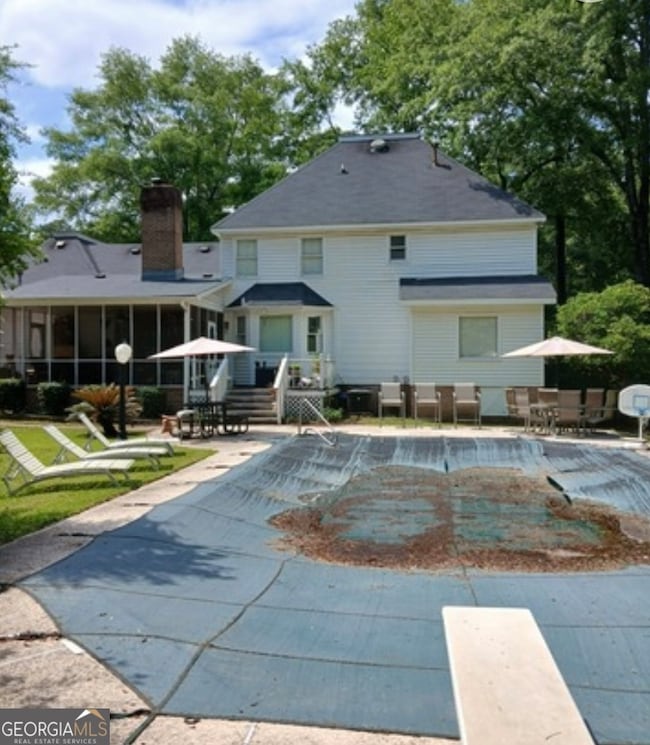
- In Ground Pool
- Main Floor Primary Bedroom
- Corner Lot
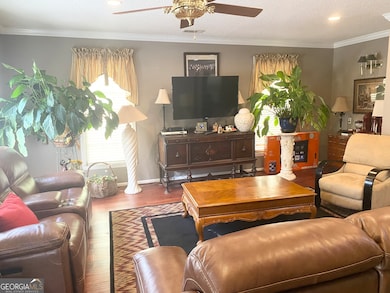
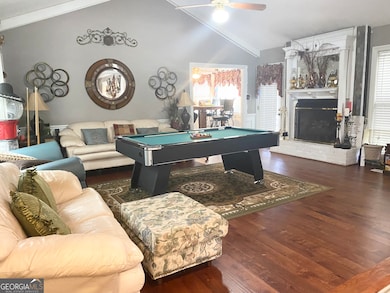
- Wood Flooring
- 1 Fireplace
- No HOA
About This Home
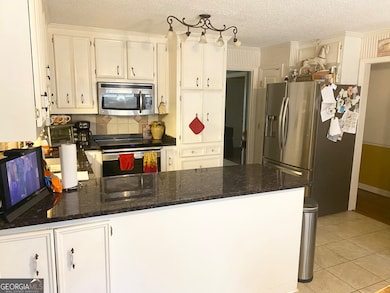
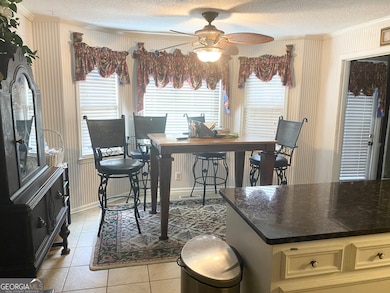
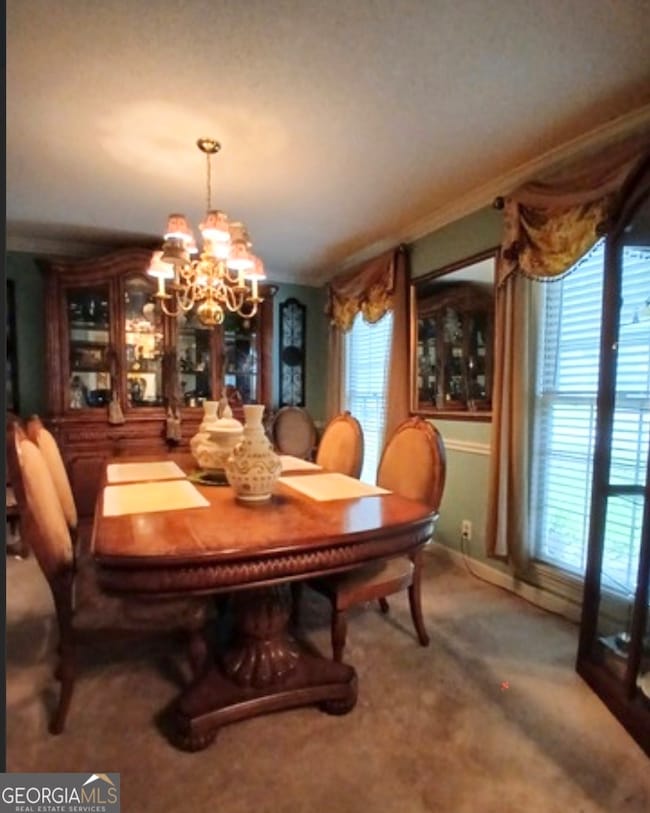
***PRICE REDUCED TO MOVE QUICKLY!!*** This meticulously maintained property features four bedrooms and four bathrooms. There is a master bedroom with an ensuite on each level for added convenience. The kitchen offers generous space and is complemented by a formal dining room. The expansive living room includes a brick fireplace, and the large den provides additional options for entertaining. Two HVACs heat/cool the home and the roof new!! Ample parking is available, with a three-car covered area as well as plenty of guest parking. Situated on a well-manicured half-acre corner lot, the home boasts a backyard with an open deck, screened porch, and in-ground pool.

Home Details
Home Type
- Single Family
Est. Annual Taxes
- $2,622
Year Built
- Built in 1982
Lot Details
- 0.57 Acre Lot
- Privacy Fence
- Back Yard Fenced
- Corner Lot
Home Design
- Composition Roof
- Vinyl Siding
Interior Spaces
- 2,918 Sq Ft Home
- 2-Story Property
- 1 Fireplace
- Family Room
- Formal Dining Room
- Den
- Laundry Room
Kitchen
- Cooktop
- Microwave
- Dishwasher
Flooring
- Wood
- Carpet
Bedrooms and Bathrooms
- 4 Bedrooms | 1 Primary Bedroom on Main
Parking
- 3 Parking Spaces
- Carport
Schools
- Carter Elementary School
- Howard Middle School
- Howard High School
Additional Features
- In Ground Pool
- Central Heating and Cooling System
Community Details
- No Home Owners Association
- Castlegate Subdivision
Listing and Financial Details
- Tax Lot 277
Map
Tax History
| Year | Tax Paid | Tax Assessment Tax Assessment Total Assessment is a certain percentage of the fair market value that is determined by local assessors to be the total taxable value of land and additions on the property. | Land | Improvement |
|---|---|---|---|---|
| 2025 | $2,450 | $106,685 | $13,680 | $93,005 |
| 2024 | $2,532 | $106,685 | $13,680 | $93,005 |
| 2023 | $1,982 | $103,050 | $13,680 | $89,370 |
| 2022 | $3,284 | $101,844 | $10,922 | $90,922 |
| 2021 | $3,269 | $93,023 | $9,929 | $83,094 |
| 2020 | $3,083 | $86,399 | $9,929 | $76,470 |
| 2019 | $3,084 | $78,782 | $8,936 | $69,846 |
| 2018 | $4,903 | $78,782 | $8,936 | $69,846 |
| 2017 | $2,675 | $71,403 | $10,590 | $60,813 |
| 2016 | $2,463 | $71,404 | $10,590 | $60,813 |
| 2015 | $3,472 | $77,884 | $13,238 | $64,646 |
| 2014 | $2,318 | $77,884 | $13,238 | $64,646 |
Property History
| Date | Event | Price | List to Sale | Price per Sq Ft |
|---|---|---|---|---|
| 11/18/2025 11/18/25 | Price Changed | $350,000 | -6.7% | $120 / Sq Ft |
| 10/26/2025 10/26/25 | For Sale | $375,000 | -- | $129 / Sq Ft |
Purchase History
| Date | Type | Sale Price | Title Company |
|---|---|---|---|
| Interfamily Deed Transfer | -- | None Available | |
| Warranty Deed | $178,000 | Attorney | |
| Warranty Deed | $195,000 | -- | |
| Warranty Deed | $151,000 | -- |
Mortgage History
| Date | Status | Loan Amount | Loan Type |
|---|---|---|---|
| Open | $174,775 | FHA |
Source: Georgia MLS
MLS Number: 10632029
APN: K051-0126
Disclaimer: Certain information contained herein is derived from information provided by parties other than Homes.com. All information provided is deemed reliable, but is not guaranteed to be accurate and should be independently verified.
![]() The data relating to real estate for sale on this web site comes in part from the Broker Reciprocity Program of Georgia MLS. Real estate listings held by brokerage firms other than Redfin are marked with the Broker Reciprocity logo and detailed information about them includes the name of the listing brokers. Information deemed reliable but not guaranteed. Copyright 2026 Georgia MLS. All rights reserved.
The data relating to real estate for sale on this web site comes in part from the Broker Reciprocity Program of Georgia MLS. Real estate listings held by brokerage firms other than Redfin are marked with the Broker Reciprocity logo and detailed information about them includes the name of the listing brokers. Information deemed reliable but not guaranteed. Copyright 2026 Georgia MLS. All rights reserved.
- 5181 Zebulon Rd
- 331 Marjane Dr
- 111 the Vinings
- 567 Billingswood Dr
- 106 Trillium Terrace
- 5104 Pine Ridge Dr
- 131 Ashford Park
- 112 Covington Place
- 4939 Guerry Dr
- 137 Senora Place
- 5914 Huddersfield Rd
- 175 Rivoli Landing
- 163 Broadleaf Dr
- 181 Rivoli Landing
- 670 Middlesex Dr
- 103 Howard Oaks Dr
- 155 Howard Oaks Dr