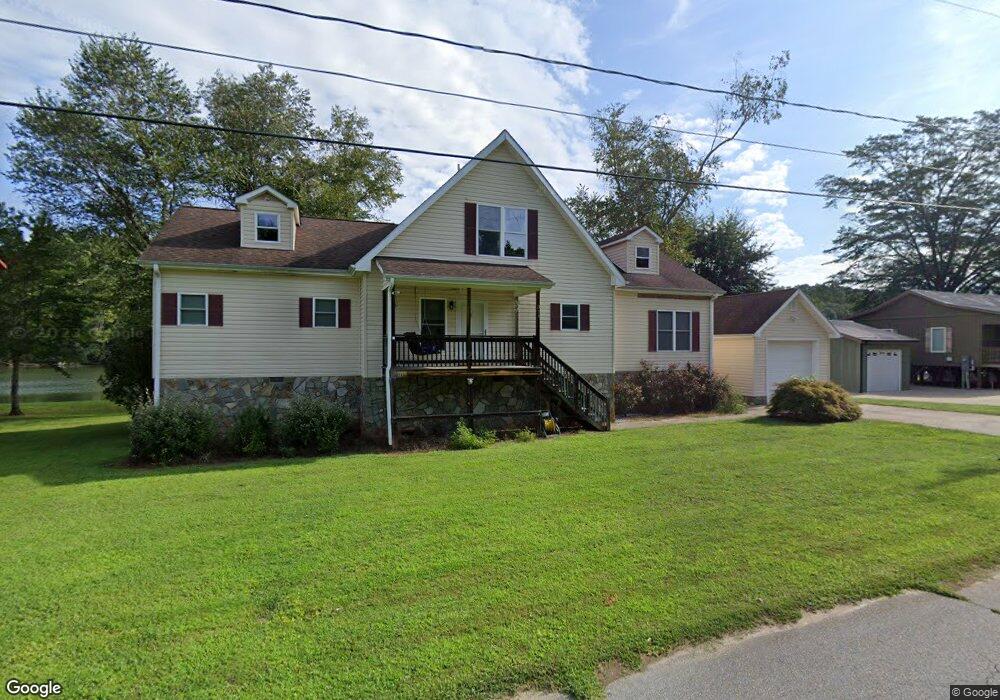
311 Catawba Ave Unit RH Hickory, NC 28601
Estimated Value: $476,000 - $526,000
3
Beds
3
Baths
2,016
Sq Ft
$250/Sq Ft
Est. Value
About This Home
This home is located at 311 Catawba Ave Unit RH, Hickory, NC 28601 and is currently estimated at $504,225, approximately $250 per square foot. 311 Catawba Ave Unit RH is a home located in Burke County with nearby schools including Ray Childers Elementary School, East Burke Middle School, and East Burke High School.
Ownership History
Date
Name
Owned For
Owner Type
Purchase Details
Closed on
May 8, 2024
Sold by
Bagley Mark N and Bagley Lorinda C
Bought by
Claridge Richard Allen and Claridge Susan
Current Estimated Value
Home Financials for this Owner
Home Financials are based on the most recent Mortgage that was taken out on this home.
Original Mortgage
$130,000
Outstanding Balance
$128,146
Interest Rate
6.79%
Mortgage Type
New Conventional
Estimated Equity
$376,079
Purchase Details
Closed on
Aug 31, 2007
Sold by
Hunt Darrell W and Hunt Vickie L
Bought by
Bagley Mark N and Bagley Lorinda C
Home Financials for this Owner
Home Financials are based on the most recent Mortgage that was taken out on this home.
Original Mortgage
$120,000
Interest Rate
7.12%
Mortgage Type
Adjustable Rate Mortgage/ARM
Create a Home Valuation Report for This Property
The Home Valuation Report is an in-depth analysis detailing your home's value as well as a comparison with similar homes in the area
Home Values in the Area
Average Home Value in this Area
Purchase History
| Date | Buyer | Sale Price | Title Company |
|---|---|---|---|
| Claridge Richard Allen | $520,000 | None Listed On Document | |
| Claridge Richard Allen | $520,000 | None Listed On Document | |
| Bagley Mark N | $150,000 | None Available |
Source: Public Records
Mortgage History
| Date | Status | Borrower | Loan Amount |
|---|---|---|---|
| Open | Claridge Richard Allen | $130,000 | |
| Closed | Claridge Richard Allen | $130,000 | |
| Previous Owner | Bagley Mark N | $120,000 |
Source: Public Records
Tax History Compared to Growth
Tax History
| Year | Tax Paid | Tax Assessment Tax Assessment Total Assessment is a certain percentage of the fair market value that is determined by local assessors to be the total taxable value of land and additions on the property. | Land | Improvement |
|---|---|---|---|---|
| 2025 | $4,176 | $378,192 | $91,200 | $286,992 |
| 2024 | $4,236 | $378,192 | $91,200 | $286,992 |
| 2023 | $4,236 | $382,269 | $91,200 | $291,069 |
| 2022 | $3,475 | $272,505 | $80,000 | $192,505 |
| 2021 | $3,469 | $272,505 | $80,000 | $192,505 |
| 2020 | $3,465 | $272,505 | $80,000 | $192,505 |
| 2019 | $3,465 | $272,505 | $80,000 | $192,505 |
| 2018 | $3,347 | $263,045 | $64,000 | $199,045 |
| 2017 | $3,345 | $263,045 | $64,000 | $199,045 |
| 2016 | $3,300 | $263,045 | $64,000 | $199,045 |
| 2015 | $3,305 | $263,686 | $64,000 | $199,686 |
| 2014 | $3,304 | $263,686 | $64,000 | $199,686 |
| 2013 | $3,304 | $263,686 | $64,000 | $199,686 |
Source: Public Records
Map
Nearby Homes
- 137 River Ridge Ln
- 209 Catawba Ave
- 0 R and Cir S Unit CAR3835569
- 103 Burch St
- 106 Dogwood Dr
- 108 Dogwood Dr
- 204 Shelby St
- 204 Hickory St Unit A
- 308 Hickory St
- 177 Duke St
- 166 Duke St
- 148 Duke St
- 00 Waters Edge Ave Unit 4
- 2066 Lake Acres Dr
- TBD Broadwater Dr Unit 9
- 224 S Main St
- 00 Link Dr
- 00 Ivory Place
- 2372 Princeton Mountain None Unit 70
- 0 Broadwater Dr Unit 160 & 166 CAR4214222
- 311 Catawba Ave
- 313 Catawba Ave
- 309 Catawba Ave Unit RH
- 307 Catawba Ave
- 317 Catawba Ave
- 00 Catawba Ave
- 0 Catawba Ave Unit CAR3829819
- 00 Catawba Ave Unit 6
- 0 Catawba Ave Unit 6
- 305 Catawba Ave
- 140 River Ridge Ln
- 303 Catawba Ave
- 136 River Ridge Ln
- 135 River Ridge Ln
- 301 Catawba Ave
- 301 Park Ave
- 150 River Ridge Ln
- 214 Catawba Ave Unit RH
- 322 Catawba Ave
- 211 Catawba Ave Unit RH