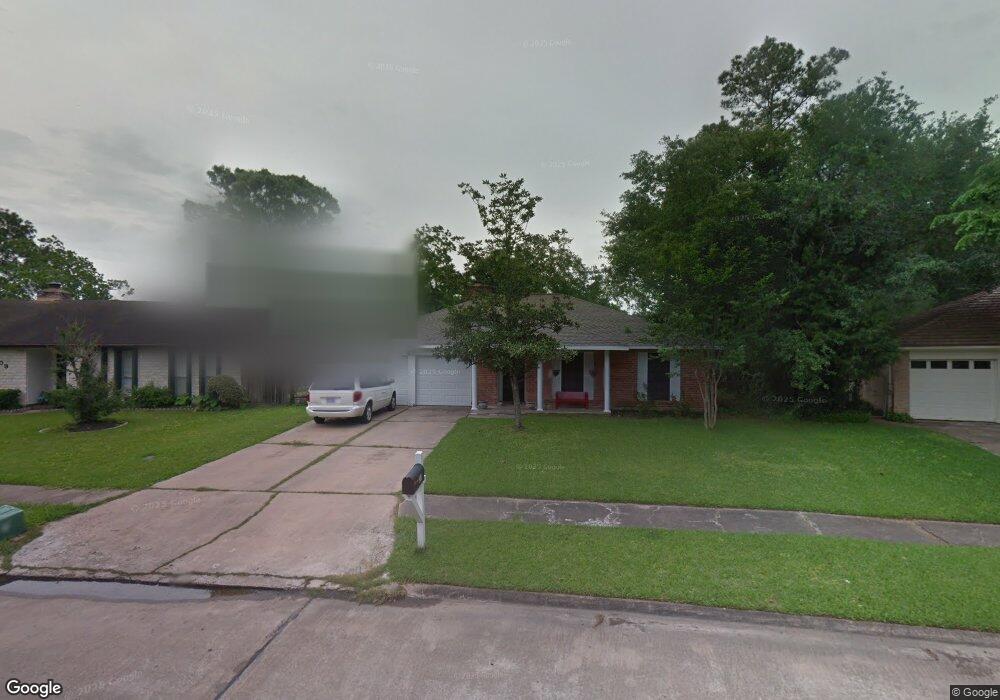
311 Chelsea Ln Friendswood, TX 77546
Estimated Value: $268,385 - $303,000
4
Beds
2
Baths
1,507
Sq Ft
$189/Sq Ft
Est. Value
About This Home
This home is located at 311 Chelsea Ln, Friendswood, TX 77546 and is currently estimated at $284,346, approximately $188 per square foot. 311 Chelsea Ln is a home located in Galveston County with nearby schools including Westwood Elementary School, Zue S. Bales Intermediate School, and Friendswood Junior High School.
Ownership History
Date
Name
Owned For
Owner Type
Purchase Details
Closed on
Aug 16, 2016
Sold by
Bourgeois Allyson G
Bought by
Travis Graham G and Travis Katherine E
Current Estimated Value
Home Financials for this Owner
Home Financials are based on the most recent Mortgage that was taken out on this home.
Original Mortgage
$122,400
Outstanding Balance
$97,661
Interest Rate
3.48%
Mortgage Type
New Conventional
Estimated Equity
$186,685
Purchase Details
Closed on
Jun 9, 2010
Sold by
Murphy George Louis and Williams Jennifer
Bought by
Bourgeois Allyson G
Home Financials for this Owner
Home Financials are based on the most recent Mortgage that was taken out on this home.
Original Mortgage
$113,372
Interest Rate
4.93%
Mortgage Type
FHA
Purchase Details
Closed on
Apr 6, 1999
Sold by
Smith William D
Bought by
Murphy George Louis
Create a Home Valuation Report for This Property
The Home Valuation Report is an in-depth analysis detailing your home's value as well as a comparison with similar homes in the area
Home Values in the Area
Average Home Value in this Area
Purchase History
| Date | Buyer | Sale Price | Title Company |
|---|---|---|---|
| Travis Graham G | -- | South Land Title Llc | |
| Bourgeois Allyson G | -- | First American Title | |
| Murphy George Louis | -- | -- |
Source: Public Records
Mortgage History
| Date | Status | Borrower | Loan Amount |
|---|---|---|---|
| Open | Travis Graham G | $122,400 | |
| Previous Owner | Bourgeois Allyson G | $113,372 |
Source: Public Records
Tax History Compared to Growth
Tax History
| Year | Tax Paid | Tax Assessment Tax Assessment Total Assessment is a certain percentage of the fair market value that is determined by local assessors to be the total taxable value of land and additions on the property. | Land | Improvement |
|---|---|---|---|---|
| 2025 | $3,113 | $251,172 | -- | -- |
| 2024 | $3,113 | $228,338 | -- | -- |
| 2023 | $3,113 | $207,580 | $0 | $0 |
| 2022 | $4,156 | $188,709 | $0 | $0 |
| 2021 | $4,007 | $221,510 | $22,380 | $199,130 |
| 2020 | $3,757 | $165,120 | $22,380 | $142,740 |
| 2019 | $3,600 | $141,780 | $22,380 | $119,400 |
| 2018 | $3,665 | $143,500 | $22,380 | $121,120 |
| 2017 | $3,727 | $143,500 | $22,380 | $121,120 |
| 2016 | $3,242 | $137,460 | $22,380 | $115,080 |
| 2015 | $1,031 | $127,450 | $22,380 | $105,070 |
| 2014 | $971 | $103,180 | $22,380 | $80,800 |
Source: Public Records
Map
Nearby Homes
- 808 Merribrook Ln
- 301 Brandywyne Dr
- 515 Brandywyne Dr
- 3901 Kimberly Dr
- 409 Linda Ln
- 511 Bellmar Ln
- 111 Dunbar Estates Dr Unit 203
- 405 Linda Ln
- 401 Castlelake Dr
- 514 Bellmar Ln
- 510 Portage Ln
- 3613 Pine Valley Dr
- 415 Bellmar Ln
- 3910 Kimberly Dr
- 502 Bellmar Ln
- 605 Tanglewood Dr
- 307 Bellmar Ln
- 308 Virginia Ln
- 0 Tanglewood Dr
- 1211 Woodchase Dr
- 309 Chelsea Ln
- 313 Chelsea Ln
- 308 Stonehenge Ln
- 306 Stonehenge Ln
- 307 Chelsea Ln
- 401 Chelsea Ln
- 310 Stonehenge Ln
- 800 Lochmoor Ln
- 304 Stonehenge Ln
- 305 Chelsea Ln
- 801 Chelsea Ln
- 802 Lochmoor Ln
- 400 Stonehenge Ln
- 403 Chelsea Ln
- 703 British Woods Ln
- 801 Lochmoor Ln
- 302 Stonehenge Ln
- 303 Chelsea Ln
- 804 Lochmoor Ln
- 705 British Woods Ln