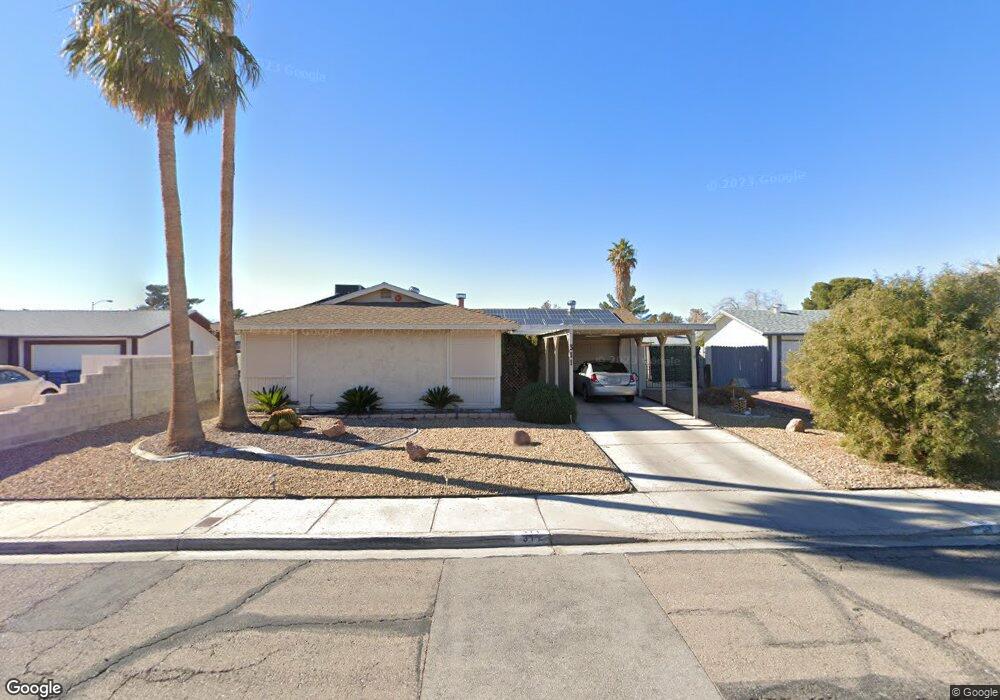
311 Clarges Ln Las Vegas, NV 89110
Estimated Value: $338,414 - $372,000
3
Beds
2
Baths
1,092
Sq Ft
$325/Sq Ft
Est. Value
About This Home
This home is located at 311 Clarges Ln, Las Vegas, NV 89110 and is currently estimated at $355,104, approximately $325 per square foot. 311 Clarges Ln is a home located in Clark County with nearby schools including Richard J. Rundle Elementary School, Charlotte & Jerry Keller Elementary School, and Duane D. Keller Middle School.
Ownership History
Date
Name
Owned For
Owner Type
Purchase Details
Closed on
Feb 10, 2021
Sold by
Brown Michael W
Bought by
Brown Michael W
Current Estimated Value
Home Financials for this Owner
Home Financials are based on the most recent Mortgage that was taken out on this home.
Original Mortgage
$154,000
Outstanding Balance
$137,497
Interest Rate
2.6%
Mortgage Type
New Conventional
Estimated Equity
$217,607
Purchase Details
Closed on
Jul 28, 2008
Sold by
Whittington Heidi C
Bought by
Brown Michael M and Brown Sheila M
Home Financials for this Owner
Home Financials are based on the most recent Mortgage that was taken out on this home.
Original Mortgage
$157,528
Interest Rate
6.41%
Mortgage Type
FHA
Purchase Details
Closed on
Apr 6, 2000
Sold by
Mulick Mark
Bought by
Whittington Heidi C
Home Financials for this Owner
Home Financials are based on the most recent Mortgage that was taken out on this home.
Original Mortgage
$111,084
Interest Rate
8.24%
Mortgage Type
FHA
Purchase Details
Closed on
Oct 1, 1999
Sold by
Mulick Mark D
Bought by
Mulick Mark D and Mark Mulick Revocable Living Trust
Create a Home Valuation Report for This Property
The Home Valuation Report is an in-depth analysis detailing your home's value as well as a comparison with similar homes in the area
Home Values in the Area
Average Home Value in this Area
Purchase History
| Date | Buyer | Sale Price | Title Company |
|---|---|---|---|
| Brown Michael W | -- | Driggs Title Agency Inc | |
| Brown Michael M | $160,000 | Lawyers Title Of Nevada Inc | |
| Whittington Heidi C | $112,000 | First American Title Co | |
| Mulick Mark D | -- | -- |
Source: Public Records
Mortgage History
| Date | Status | Borrower | Loan Amount |
|---|---|---|---|
| Open | Brown Michael W | $154,000 | |
| Previous Owner | Brown Michael M | $157,528 | |
| Previous Owner | Whittington Heidi C | $111,084 |
Source: Public Records
Tax History Compared to Growth
Tax History
| Year | Tax Paid | Tax Assessment Tax Assessment Total Assessment is a certain percentage of the fair market value that is determined by local assessors to be the total taxable value of land and additions on the property. | Land | Improvement |
|---|---|---|---|---|
| 2025 | $681 | $50,653 | $27,300 | $23,353 |
| 2024 | $662 | $50,653 | $27,300 | $23,353 |
| 2023 | $540 | $51,039 | $28,000 | $23,039 |
| 2022 | $648 | $43,752 | $22,400 | $21,352 |
| 2021 | $624 | $41,671 | $21,000 | $20,671 |
| 2020 | $603 | $41,143 | $20,300 | $20,843 |
| 2019 | $586 | $36,218 | $15,400 | $20,818 |
| 2018 | $569 | $33,564 | $13,300 | $20,264 |
| 2017 | $958 | $32,656 | $11,900 | $20,756 |
| 2016 | $540 | $29,440 | $8,050 | $21,390 |
| 2015 | $537 | $25,914 | $5,600 | $20,314 |
| 2014 | $522 | $17,256 | $4,550 | $12,706 |
Source: Public Records
Map
Nearby Homes
- 360 Sir Richard Dr E
- 147 N Christy Ln
- 332 Sir Jeffery Cir
- 280 Sir Phillip St
- 316 Linn Ln
- 5564 Orchard Ln Unit 133
- 5583 Orchard Ln Unit 152
- 262 Solicito St
- 5600 Orchard Ln
- 522 Wheaties Way
- 5854 Heather Marie Dr
- 266 Lyra Ln
- 179 Sir George Dr
- 5794 Sea Breeze Ave
- 5529 Cedar Ave
- 5330 E Charleston Blvd Unit 2
- 5330 E Charleston Blvd Unit 113
- 5907 Zawawi Ct
- 153 Sir Thomas Dr
- 136 Sir George Dr