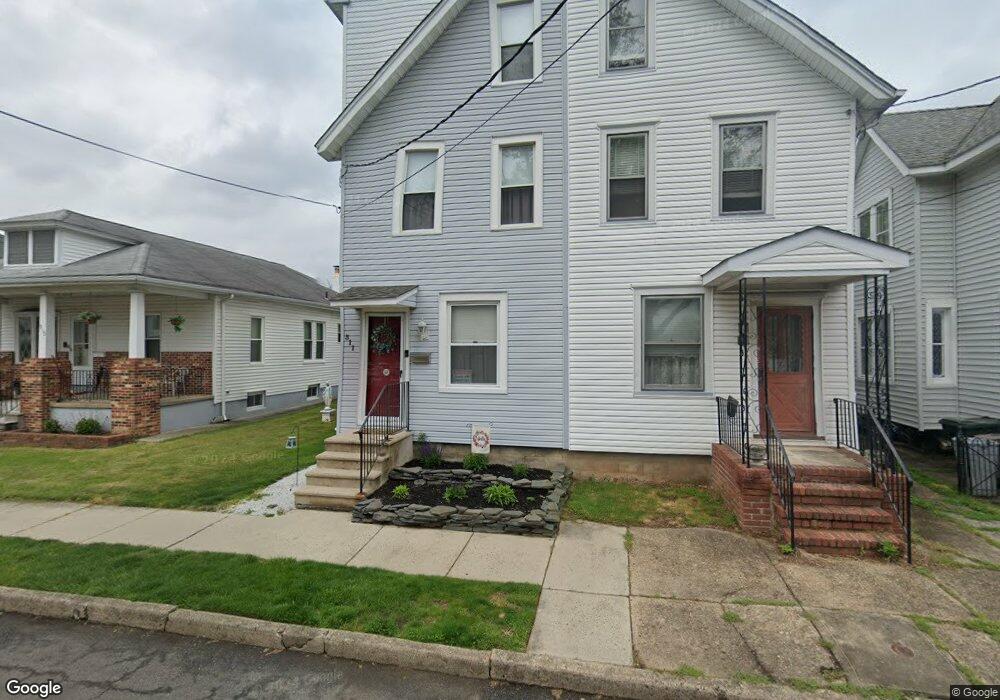
311 Conover St Burlington, NJ 08016
Estimated Value: $253,000 - $300,000
3
Beds
1
Bath
1,752
Sq Ft
$157/Sq Ft
Est. Value
About This Home
This home is located at 311 Conover St, Burlington, NJ 08016 and is currently estimated at $275,279, approximately $157 per square foot. 311 Conover St is a home located in Burlington County with nearby schools including Burlington City High School, Doane Academy, and St Paul's Parochial School.
Ownership History
Date
Name
Owned For
Owner Type
Purchase Details
Closed on
Jun 13, 2018
Sold by
Vining Justin and Taylor Melissa
Bought by
Taylor Melissa Lynn
Current Estimated Value
Purchase Details
Closed on
Jun 30, 2006
Sold by
Huizenga Susan Joy
Bought by
Vining Justin and Taylor Melissa
Home Financials for this Owner
Home Financials are based on the most recent Mortgage that was taken out on this home.
Original Mortgage
$6,498
Interest Rate
6.67%
Mortgage Type
Purchase Money Mortgage
Purchase Details
Closed on
Apr 14, 2004
Sold by
Huizenga Susan Joy and Crane Susan
Bought by
Huizenga Susan Joy
Purchase Details
Closed on
Feb 3, 2003
Sold by
Tepfer Donald H and Podolak Virginia H
Bought by
Crane Susan Joy
Home Financials for this Owner
Home Financials are based on the most recent Mortgage that was taken out on this home.
Original Mortgage
$121,050
Interest Rate
5.98%
Mortgage Type
FHA
Create a Home Valuation Report for This Property
The Home Valuation Report is an in-depth analysis detailing your home's value as well as a comparison with similar homes in the area
Home Values in the Area
Average Home Value in this Area
Purchase History
| Date | Buyer | Sale Price | Title Company |
|---|---|---|---|
| Taylor Melissa Lynn | -- | None Available | |
| Vining Justin | $171,000 | None Available | |
| Huizenga Susan Joy | -- | -- | |
| Crane Susan Joy | $123,000 | -- |
Source: Public Records
Mortgage History
| Date | Status | Borrower | Loan Amount |
|---|---|---|---|
| Closed | Vining Justin | $6,498 | |
| Previous Owner | Crane Susan Joy | $121,050 |
Source: Public Records
Tax History Compared to Growth
Tax History
| Year | Tax Paid | Tax Assessment Tax Assessment Total Assessment is a certain percentage of the fair market value that is determined by local assessors to be the total taxable value of land and additions on the property. | Land | Improvement |
|---|---|---|---|---|
| 2025 | $5,153 | $119,000 | $32,600 | $86,400 |
| 2024 | $5,062 | $119,000 | $32,600 | $86,400 |
| 2023 | $5,062 | $119,000 | $32,600 | $86,400 |
| 2022 | $5,006 | $119,000 | $32,600 | $86,400 |
| 2021 | $4,934 | $119,000 | $32,600 | $86,400 |
| 2020 | $4,758 | $119,000 | $32,600 | $86,400 |
| 2019 | $4,537 | $119,000 | $32,600 | $86,400 |
| 2018 | $4,947 | $132,000 | $32,600 | $99,400 |
| 2017 | $4,796 | $132,000 | $32,600 | $99,400 |
| 2016 | $4,615 | $132,000 | $32,600 | $99,400 |
| 2015 | $4,450 | $132,000 | $32,600 | $99,400 |
| 2014 | $4,303 | $132,000 | $32,600 | $99,400 |
Source: Public Records
Map
Nearby Homes