Estimated Value: $344,000 - $371,000
Studio
2
Baths
2,105
Sq Ft
$172/Sq Ft
Est. Value
About This Home
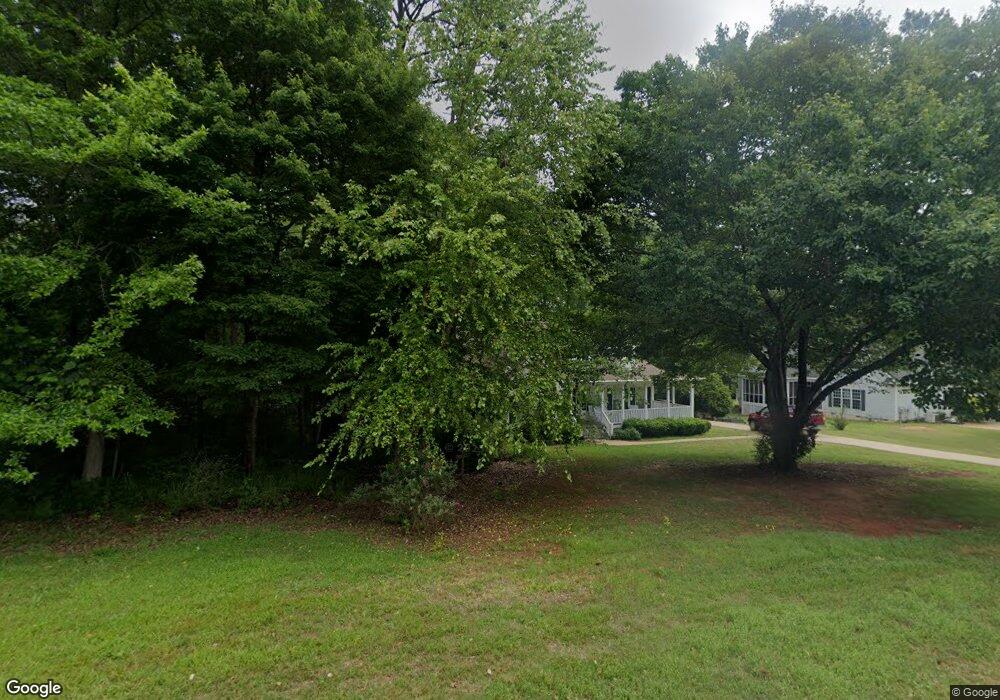
This home is located at 311 Crestview Trace, Gray, GA 31032 and is currently estimated at $361,911, approximately $171 per square foot. 311 Crestview Trace is a home located in Jones County with nearby schools including Dames Ferry Elementary School, Gray Station Middle School, and Jones County High School.
Ownership History
Date
Name
Owned For
Owner Type
Purchase Details
Closed on
Oct 8, 2020
Sold by
Robinson Mark K
Bought by
Sanders David E and Sanders Morgan E
Current Estimated Value
Home Financials for this Owner
Home Financials are based on the most recent Mortgage that was taken out on this home.
Original Mortgage
$275,187
Outstanding Balance
$242,632
Interest Rate
2.8%
Mortgage Type
New Conventional
Estimated Equity
$119,279
Purchase Details
Closed on
Sep 26, 2005
Sold by
Robinson Mark K
Bought by
Robinson Mark K and Robinson Dawn B
Purchase Details
Closed on
Aug 30, 2000
Bought by
Robinson Mark K
Create a Home Valuation Report for This Property
The Home Valuation Report is an in-depth analysis detailing your home's value as well as a comparison with similar homes in the area
Home Values in the Area
Average Home Value in this Area
Purchase History
| Date | Buyer | Sale Price | Title Company |
|---|---|---|---|
| Sanders David E | $269,000 | -- | |
| Robinson Mark K | -- | -- | |
| Robinson Mark K | $30,000 | -- |
Source: Public Records
Mortgage History
| Date | Status | Borrower | Loan Amount |
|---|---|---|---|
| Open | Sanders David E | $275,187 |
Source: Public Records
Tax History
| Year | Tax Paid | Tax Assessment Tax Assessment Total Assessment is a certain percentage of the fair market value that is determined by local assessors to be the total taxable value of land and additions on the property. | Land | Improvement |
|---|---|---|---|---|
| 2025 | $4,702 | $143,353 | $17,940 | $125,413 |
| 2023 | $3,631 | $102,225 | $13,800 | $88,425 |
| 2022 | $3,499 | $97,404 | $13,800 | $83,604 |
| 2021 | $3,503 | $97,404 | $13,800 | $83,604 |
| 2020 | $3,148 | $91,187 | $13,800 | $77,387 |
| 2019 | $3,148 | $91,187 | $13,800 | $77,387 |
| 2018 | $3,030 | $87,901 | $13,800 | $74,101 |
| 2017 | $3,030 | $87,901 | $13,800 | $74,101 |
| 2016 | $2,949 | $85,643 | $13,800 | $71,843 |
| 2015 | $2,786 | $85,643 | $13,800 | $71,843 |
| 2014 | $2,571 | $85,643 | $13,800 | $71,843 |
Source: Public Records
Map
Nearby Homes
- 1134 Porter Cir
- 337 Georgia 18
- 320 Amanda Dr
- 1129 Porter Cir
- 354 Pineview Rd
- 3331 Trotters Ridge Trail
- 0 Braswell Lake Rd
- 128 Clinton Crossing Dr
- 0 Clinton Crossing Dr Unit M181966
- 266 Clinton Crossing Dr
- 146 Lite N Tie Rd
- 140 Lite-N-tie Rd
- 191 Henry Dr
- 354 Lite N Tie Rd
- 0 Clinton Crossing Unit 10637924
- 229 Lite N Tie Rd
- 173 Henry Dr
- 000 Walnut Grove Rd
- 0 Walnut Grove Rd Unit 10697101
- 00 Walnut Grove Rd
- 312 Crestview Trace
- 301 Crestview Trace
- 293 Crestview Trace
- 293 Crestview Trace Unit Tr
- 293 Crestview Trace Unit 26
- 410 Crestview Ln
- 406 Crestview Ln
- 287 Crestview Trace
- 306 Crestview Trace
- 159 Oakview Cir
- 304 Crestview Trace
- 304 Crestview Trace Unit 21
- 155 Oakview Cir
- 167 Oakview Cir
- 294 Crestview Trace
- 300 Crestview Trace
- 153 Oakview Cir
- 412 Crestview Ln
- 302 Crestview Trace
- 279 Crestview Trace
Your Personal Tour Guide
Ask me questions while you tour the home.