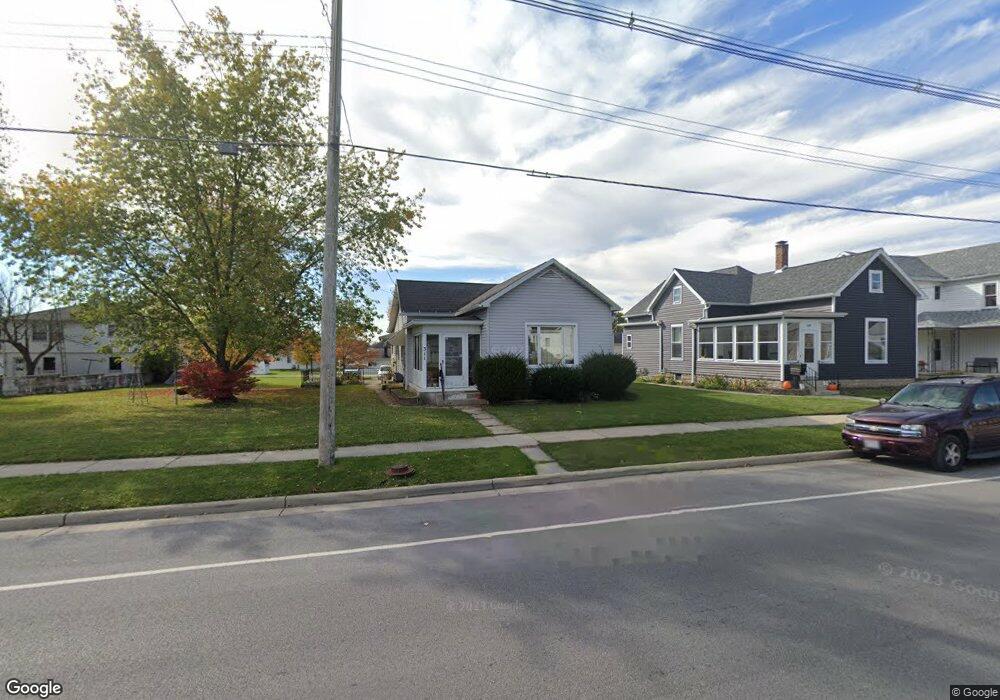
311 Defiance St Wapakoneta, OH 45895
Estimated Value: $130,000 - $202,000
3
Beds
1
Bath
1,396
Sq Ft
$120/Sq Ft
Est. Value
About This Home
This home is located at 311 Defiance St, Wapakoneta, OH 45895 and is currently estimated at $167,667, approximately $120 per square foot. 311 Defiance St is a home located in Auglaize County with nearby schools including Wapakoneta Elementary School, Wapakoneta High School, and Wapakoneta Middle School.
Ownership History
Date
Name
Owned For
Owner Type
Purchase Details
Closed on
Jun 6, 2024
Sold by
Wjb Enterprises and Wjb Enterprises Llc
Bought by
Wjb Enterprises Llc
Current Estimated Value
Home Financials for this Owner
Home Financials are based on the most recent Mortgage that was taken out on this home.
Original Mortgage
$280,000
Outstanding Balance
$271,958
Interest Rate
7.22%
Mortgage Type
Credit Line Revolving
Estimated Equity
-$104,291
Purchase Details
Closed on
Mar 1, 2024
Sold by
Sheriff Of Auglaize County
Bought by
Wjb Enterprises and Fisher
Purchase Details
Closed on
Dec 11, 1998
Sold by
Thiebeau Norman and Thiebeau Connie
Bought by
Fisher Susan A
Purchase Details
Closed on
Nov 24, 1998
Sold by
Thiebeau Norman and Thiebeau Connie
Bought by
Thiebeau Norman and Thiebeau Connie
Create a Home Valuation Report for This Property
The Home Valuation Report is an in-depth analysis detailing your home's value as well as a comparison with similar homes in the area
Home Values in the Area
Average Home Value in this Area
Purchase History
| Date | Buyer | Sale Price | Title Company |
|---|---|---|---|
| Wjb Enterprises Llc | -- | None Listed On Document | |
| Wjb Enterprises | $119,300 | None Listed On Document | |
| Fisher Susan A | $62,500 | -- | |
| Thiebeau Norman | -- | -- |
Source: Public Records
Mortgage History
| Date | Status | Borrower | Loan Amount |
|---|---|---|---|
| Open | Wjb Enterprises Llc | $280,000 |
Source: Public Records
Tax History Compared to Growth
Tax History
| Year | Tax Paid | Tax Assessment Tax Assessment Total Assessment is a certain percentage of the fair market value that is determined by local assessors to be the total taxable value of land and additions on the property. | Land | Improvement |
|---|---|---|---|---|
| 2024 | $1,644 | $33,730 | $6,410 | $27,320 |
| 2023 | $1,109 | $33,730 | $6,410 | $27,320 |
| 2022 | $929 | $25,830 | $5,780 | $20,050 |
| 2021 | $909 | $25,830 | $5,780 | $20,050 |
| 2020 | $912 | $25,830 | $5,782 | $20,048 |
| 2019 | $783 | $21,263 | $4,750 | $16,513 |
| 2018 | $786 | $21,263 | $4,750 | $16,513 |
| 2017 | $782 | $21,263 | $4,750 | $16,513 |
| 2016 | $739 | $20,143 | $4,487 | $15,656 |
| 2015 | $729 | $20,143 | $4,487 | $15,656 |
| 2014 | $737 | $20,143 | $4,487 | $15,656 |
| 2013 | $750 | $20,143 | $4,487 | $15,656 |
Source: Public Records
Map
Nearby Homes