311 Delia Dr Commerce, GA 30529
Commerce Township Downtown NeighborhoodEstimated Value: $347,000 - $387,000
3
Beds
2
Baths
1,981
Sq Ft
$186/Sq Ft
Est. Value
About This Home
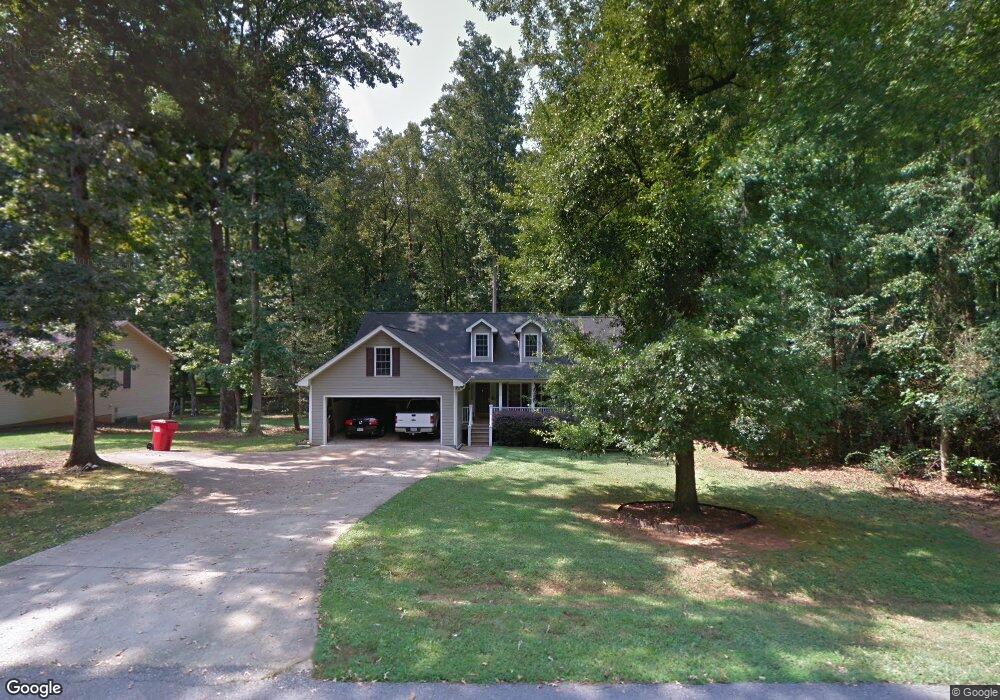
This home is located at 311 Delia Dr, Commerce, GA 30529 and is currently estimated at $368,281, approximately $185 per square foot. 311 Delia Dr is a home located in Jackson County with nearby schools including Maysville Elementary School, East Jackson Middle School, and East Jackson Comprehensive High School.
Ownership History
Date
Name
Owned For
Owner Type
Purchase Details
Closed on
Nov 16, 2006
Sold by
Not Provided
Bought by
Brice Robert Samuel and Brice Debbie S
Current Estimated Value
Purchase Details
Closed on
Feb 21, 2006
Sold by
Not Provided
Bought by
Brice Robert Samuel and Brice Debbie S
Home Financials for this Owner
Home Financials are based on the most recent Mortgage that was taken out on this home.
Original Mortgage
$118,640
Interest Rate
6.05%
Mortgage Type
New Conventional
Purchase Details
Closed on
Dec 31, 2002
Sold by
Baugh William N and Baugh Ri
Bought by
Baugh William N
Purchase Details
Closed on
Sep 15, 2000
Sold by
Thomas Theresa L
Bought by
Baugh William N and Baugh Ri
Purchase Details
Closed on
Nov 12, 1999
Sold by
Boswell George and Boswell Lou
Bought by
Thomas Theresa L
Create a Home Valuation Report for This Property
The Home Valuation Report is an in-depth analysis detailing your home's value as well as a comparison with similar homes in the area
Home Values in the Area
Average Home Value in this Area
Purchase History
| Date | Buyer | Sale Price | Title Company |
|---|---|---|---|
| Brice Robert Samuel | -- | -- | |
| Brice Robert Samuel | $148,300 | -- | |
| Baugh William N | -- | -- | |
| Baugh William N | $129,000 | -- | |
| Thomas Theresa L | $14,000 | -- |
Source: Public Records
Mortgage History
| Date | Status | Borrower | Loan Amount |
|---|---|---|---|
| Previous Owner | Brice Robert Samuel | $118,640 |
Source: Public Records
Tax History Compared to Growth
Tax History
| Year | Tax Paid | Tax Assessment Tax Assessment Total Assessment is a certain percentage of the fair market value that is determined by local assessors to be the total taxable value of land and additions on the property. | Land | Improvement |
|---|---|---|---|---|
| 2024 | $762 | $103,440 | $8,240 | $95,200 |
| 2023 | $1,736 | $90,880 | $8,240 | $82,640 |
| 2022 | $1,129 | $72,480 | $7,000 | $65,480 |
| 2021 | $2,093 | $72,480 | $7,000 | $65,480 |
| 2020 | $1,939 | $61,280 | $7,000 | $54,280 |
| 2019 | $1,968 | $61,280 | $7,000 | $54,280 |
| 2018 | $1,911 | $58,680 | $7,000 | $51,680 |
| 2017 | $1,902 | $57,902 | $7,004 | $50,898 |
| 2016 | $1,913 | $57,902 | $7,004 | $50,898 |
| 2015 | $1,921 | $57,902 | $7,004 | $50,898 |
| 2014 | $1,939 | $58,004 | $7,004 | $51,000 |
| 2013 | -- | $58,004 | $7,004 | $51,000 |
Source: Public Records
Map
Nearby Homes