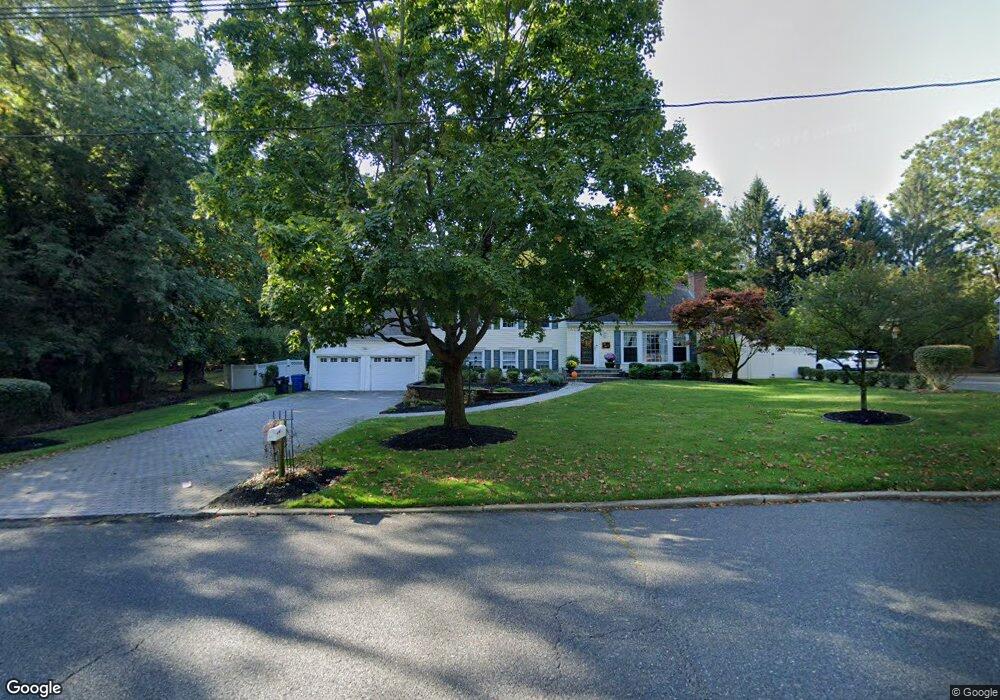
311 Dwight Rd Middletown, NJ 07748
New Monmouth NeighborhoodEstimated Value: $926,000 - $1,050,000
4
Beds
3
Baths
2,488
Sq Ft
$403/Sq Ft
Est. Value
About This Home
This home is located at 311 Dwight Rd, Middletown, NJ 07748 and is currently estimated at $1,003,565, approximately $403 per square foot. 311 Dwight Rd is a home located in Monmouth County with nearby schools including Nut Swamp Elementary School, Thompson Middle School, and Middletown - South High School.
Ownership History
Date
Name
Owned For
Owner Type
Purchase Details
Closed on
Jun 30, 1997
Sold by
Hroblak Joseph
Bought by
Cammarato Salvatore and Cammarato Margaret
Current Estimated Value
Home Financials for this Owner
Home Financials are based on the most recent Mortgage that was taken out on this home.
Original Mortgage
$150,000
Outstanding Balance
$22,050
Interest Rate
7.79%
Estimated Equity
$981,515
Purchase Details
Closed on
May 27, 1994
Sold by
Desarle Andrew
Bought by
Hroblak Joseph and Hroblak Pamela
Home Financials for this Owner
Home Financials are based on the most recent Mortgage that was taken out on this home.
Original Mortgage
$212,000
Interest Rate
8.5%
Purchase Details
Closed on
Nov 15, 1993
Sold by
Tang Thomas
Bought by
Desarle Andrew and Desarle Donna
Home Financials for this Owner
Home Financials are based on the most recent Mortgage that was taken out on this home.
Original Mortgage
$203,000
Interest Rate
6.77%
Create a Home Valuation Report for This Property
The Home Valuation Report is an in-depth analysis detailing your home's value as well as a comparison with similar homes in the area
Home Values in the Area
Average Home Value in this Area
Purchase History
| Date | Buyer | Sale Price | Title Company |
|---|---|---|---|
| Cammarato Salvatore | $272,000 | -- | |
| Hroblak Joseph | $230,000 | -- | |
| Desarle Andrew | $225,000 | -- |
Source: Public Records
Mortgage History
| Date | Status | Borrower | Loan Amount |
|---|---|---|---|
| Open | Cammarato Salvatore | $150,000 | |
| Previous Owner | Hroblak Joseph | $212,000 | |
| Previous Owner | Desarle Andrew | $203,000 |
Source: Public Records
Tax History Compared to Growth
Tax History
| Year | Tax Paid | Tax Assessment Tax Assessment Total Assessment is a certain percentage of the fair market value that is determined by local assessors to be the total taxable value of land and additions on the property. | Land | Improvement |
|---|---|---|---|---|
| 2025 | $13,257 | $965,200 | $467,600 | $497,600 |
| 2024 | $13,543 | $805,900 | $317,400 | $488,500 |
| 2023 | $13,543 | $779,200 | $357,800 | $421,400 |
| 2022 | $13,006 | $684,700 | $283,500 | $401,200 |
| 2021 | $13,006 | $625,600 | $268,800 | $356,800 |
| 2020 | $12,986 | $607,400 | $258,600 | $348,800 |
| 2019 | $12,786 | $605,400 | $258,600 | $346,800 |
| 2018 | $12,768 | $589,200 | $258,600 | $330,600 |
| 2017 | $12,385 | $583,100 | $258,600 | $324,500 |
| 2016 | $12,059 | $565,900 | $249,600 | $316,300 |
| 2015 | $11,611 | $543,600 | $231,600 | $312,000 |
| 2014 | $11,114 | $507,700 | $222,600 | $285,100 |
Source: Public Records
Map
Nearby Homes
- 185 Ballantine Rd
- 234 Borden Rd
- 7 Cormorant Dr
- 20 Cormorant Dr
- 83 Green Meadow Blvd
- 911 Middletown Lincroft Rd
- 17 Terry Ln
- 246 Sunnyside Rd
- 74 Fish Hawk Dr
- 111 Crawfords Corner Rd
- 86 Stillwell Rd
- 93 Wallace Rd
- 45 Galloping Hill Cir
- 7 Mccampbell Rd
- 1476 W Front St
- 17 Spalding Dr
- 1497 W Front St
- 23 Stratford Ln Unit 483
- 4 E Parkway Place
- 30 Winchester Ln