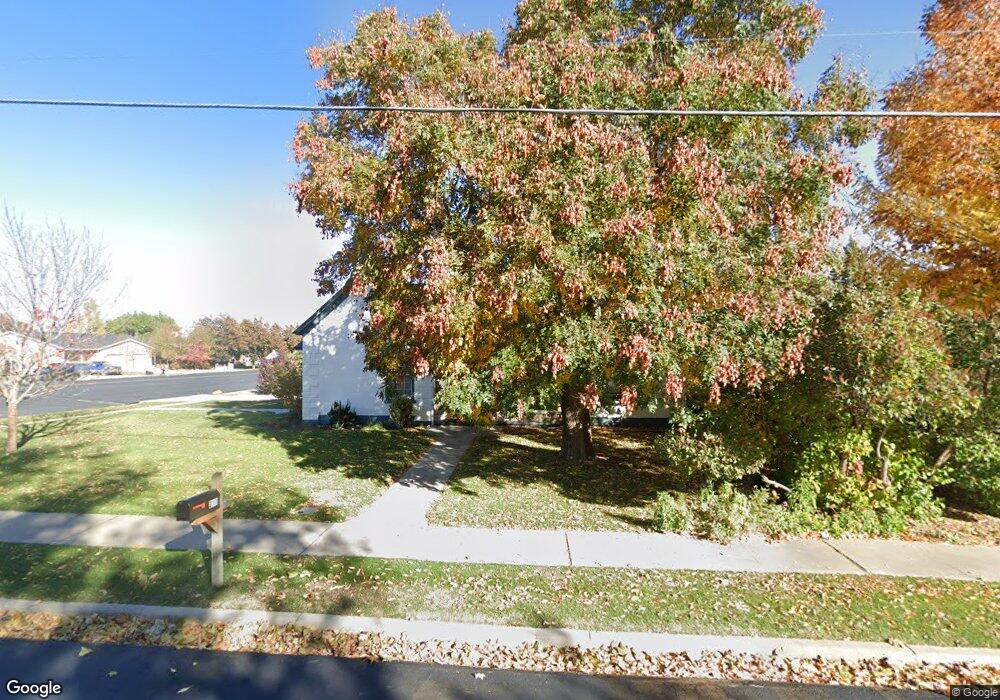
311 E 100 N Spanish Fork, UT 84660
Estimated Value: $377,000 - $455,000
3
Beds
1
Bath
1,865
Sq Ft
$217/Sq Ft
Est. Value
About This Home
This home is located at 311 E 100 N, Spanish Fork, UT 84660 and is currently estimated at $405,100, approximately $217 per square foot. 311 E 100 N is a home located in Utah County with nearby schools including Park Elementary School, Spanish Fork Jr High School, and Spanish Fork High School.
Ownership History
Date
Name
Owned For
Owner Type
Purchase Details
Closed on
Jul 7, 2021
Sold by
Lebaron George W and The George W Lebaron Revocable
Bought by
Westover Brayden and Westover Whitney
Current Estimated Value
Home Financials for this Owner
Home Financials are based on the most recent Mortgage that was taken out on this home.
Original Mortgage
$339,500
Outstanding Balance
$308,044
Interest Rate
2.9%
Mortgage Type
New Conventional
Estimated Equity
$97,056
Purchase Details
Closed on
Dec 6, 2010
Sold by
Lebaron George W
Bought by
Lebaron George W and The George W Lebaron Revocable
Purchase Details
Closed on
Jan 2, 1998
Sold by
Hales Roger and Hales Jolene
Bought by
R & J Hales Properties L C
Purchase Details
Closed on
Nov 7, 1997
Sold by
Bunnell Patricia Marlene and Hales Jolene Gail
Bought by
R & J Hales Properties L C
Purchase Details
Closed on
Oct 11, 1997
Sold by
Salisbury Development L C
Bought by
Stead Thelma Marlene and Bunnell Patricia Marlene
Create a Home Valuation Report for This Property
The Home Valuation Report is an in-depth analysis detailing your home's value as well as a comparison with similar homes in the area
Home Values in the Area
Average Home Value in this Area
Purchase History
| Date | Buyer | Sale Price | Title Company |
|---|---|---|---|
| Westover Brayden | -- | Stewart Title Insurance Agcy | |
| Lebaron George W | -- | None Available | |
| Lebaron George W | -- | None Available | |
| R & J Hales Properties L C | -- | Provo Land Title | |
| R & J Hales Properties L C | -- | -- | |
| Stead Thelma Marlene | -- | Provo Land Title |
Source: Public Records
Mortgage History
| Date | Status | Borrower | Loan Amount |
|---|---|---|---|
| Open | Westover Brayden | $339,500 |
Source: Public Records
Tax History
| Year | Tax Paid | Tax Assessment Tax Assessment Total Assessment is a certain percentage of the fair market value that is determined by local assessors to be the total taxable value of land and additions on the property. | Land | Improvement |
|---|---|---|---|---|
| 2025 | $1,603 | $177,980 | -- | -- |
| 2024 | $1,603 | $165,220 | $0 | $0 |
| 2023 | $1,610 | $166,100 | $0 | $0 |
| 2022 | $1,867 | $188,980 | $0 | $0 |
| 2021 | $1,613 | $261,100 | $87,500 | $173,600 |
| 2020 | $1,457 | $229,300 | $72,900 | $156,400 |
| 2019 | $1,261 | $208,900 | $72,900 | $136,000 |
| 2018 | $1,194 | $191,200 | $72,900 | $118,300 |
| 2017 | $1,053 | $90,640 | $0 | $0 |
| 2016 | $950 | $80,630 | $0 | $0 |
| 2015 | $867 | $72,765 | $0 | $0 |
| 2014 | $802 | $67,485 | $0 | $0 |
Source: Public Records
Map
Nearby Homes
Your Personal Tour Guide
Ask me questions while you tour the home.