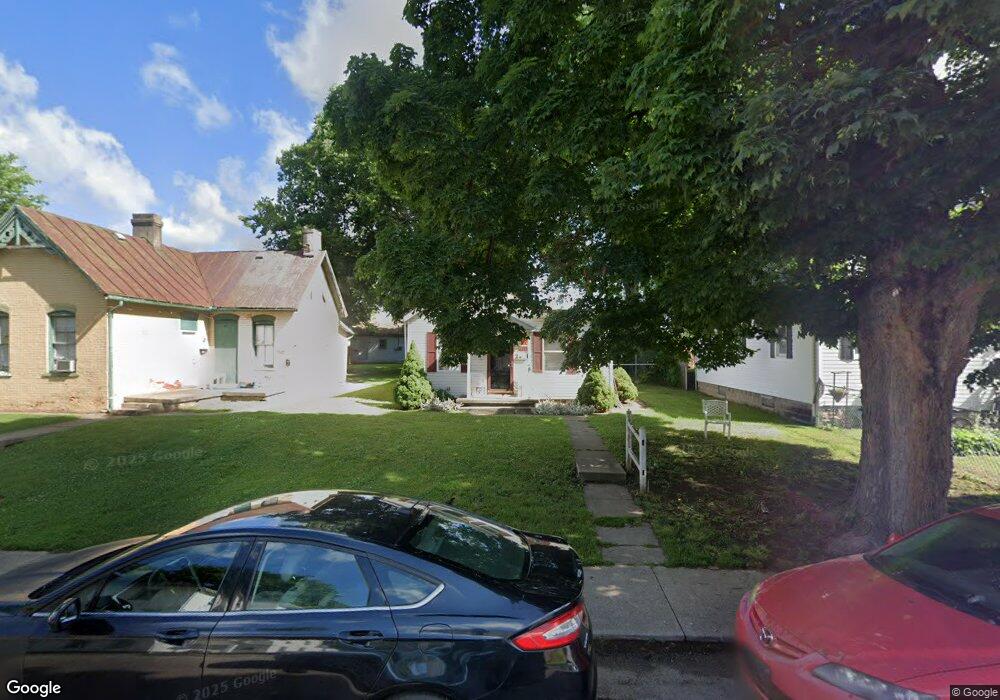
311 E 4th St Chillicothe, OH 45601
Estimated Value: $85,000 - $106,000
3
Beds
2
Baths
1,017
Sq Ft
$97/Sq Ft
Est. Value
About This Home
This home is located at 311 E 4th St, Chillicothe, OH 45601 and is currently estimated at $98,333, approximately $96 per square foot. 311 E 4th St is a home located in Ross County with nearby schools including Chillicothe High School, Bishop Flaget School, and Wesley Taylor Preparatory School.
Ownership History
Date
Name
Owned For
Owner Type
Purchase Details
Closed on
Feb 27, 2015
Sold by
Shoemaker Paul M
Bought by
Sharp Joseph T
Current Estimated Value
Purchase Details
Closed on
Nov 23, 2007
Sold by
Shoemaker Paul M
Bought by
Davis Phillip and Coffey Barbara
Home Financials for this Owner
Home Financials are based on the most recent Mortgage that was taken out on this home.
Original Mortgage
$79,900
Interest Rate
6.47%
Mortgage Type
Seller Take Back
Create a Home Valuation Report for This Property
The Home Valuation Report is an in-depth analysis detailing your home's value as well as a comparison with similar homes in the area
Home Values in the Area
Average Home Value in this Area
Purchase History
| Date | Buyer | Sale Price | Title Company |
|---|---|---|---|
| Sharp Joseph T | $8,000 | Attorney | |
| Davis Phillip | $79,900 | Scioto Valley Title Agency |
Source: Public Records
Mortgage History
| Date | Status | Borrower | Loan Amount |
|---|---|---|---|
| Previous Owner | Davis Phillip | $79,900 |
Source: Public Records
Tax History
| Year | Tax Paid | Tax Assessment Tax Assessment Total Assessment is a certain percentage of the fair market value that is determined by local assessors to be the total taxable value of land and additions on the property. | Land | Improvement |
|---|---|---|---|---|
| 2024 | $652 | $15,980 | $4,250 | $11,730 |
| 2023 | $652 | $15,980 | $4,250 | $11,730 |
| 2022 | $664 | $15,980 | $4,250 | $11,730 |
| 2021 | $604 | $12,740 | $3,470 | $9,270 |
| 2020 | $603 | $12,740 | $3,470 | $9,270 |
| 2019 | $604 | $12,740 | $3,470 | $9,270 |
| 2018 | $608 | $12,140 | $3,470 | $8,670 |
| 2017 | $654 | $12,140 | $3,470 | $8,670 |
| 2016 | $648 | $12,140 | $3,470 | $8,670 |
| 2015 | $647 | $11,820 | $3,470 | $8,350 |
| 2014 | $635 | $11,820 | $3,470 | $8,350 |
| 2013 | $635 | $11,820 | $3,470 | $8,350 |
Source: Public Records
Map
Nearby Homes
- 0 N Bridge St
- 0 Ohio 159
- 348 E 4th St
- 81 S Hickory St
- 72 N Hickory St
- 158 N Sugar St
- 153 Hirn St
- 394 Clay St
- 90 E 2nd St
- 219 N Bridge St
- 320 Mckellar St
- 520-522 E Water St
- 249 Madeira Ave
- 23 N Brownell St
- 607 E Main St
- 0 US Hwy 23 Unit 198667
- 255 Caldwell St
- 29 S Watt St
- 692 Washington Ave
- 746 Madison Ave
Your Personal Tour Guide
Ask me questions while you tour the home.