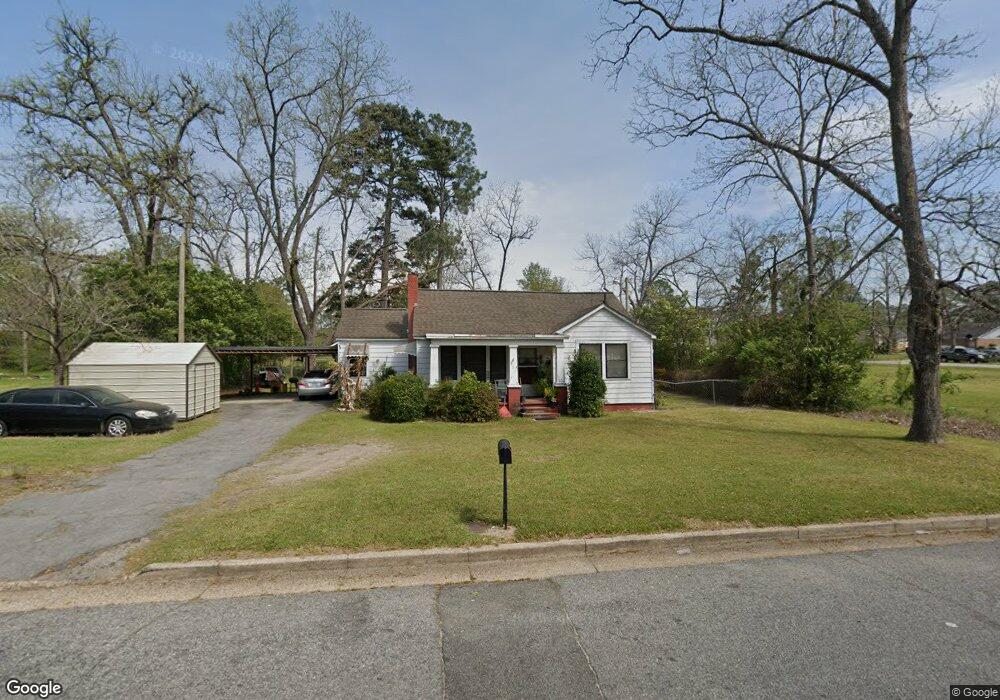
311 E 5th Ave Cordele, GA 31015
Estimated Value: $92,516 - $882,000
3
Beds
1
Bath
1,245
Sq Ft
$237/Sq Ft
Est. Value
About This Home
This home is located at 311 E 5th Ave, Cordele, GA 31015 and is currently estimated at $294,879, approximately $236 per square foot. 311 E 5th Ave is a home located in Crisp County with nearby schools including Crisp County Elementary School, Crisp County Primary School, and Crisp County Middle School.
Ownership History
Date
Name
Owned For
Owner Type
Purchase Details
Closed on
Jul 14, 2004
Sold by
Jackson Alphonso*
Bought by
Zervas Dino
Current Estimated Value
Purchase Details
Closed on
Sep 2, 2003
Sold by
Cendant Mortgage Corp*
Bought by
Jackson Alphonso*
Purchase Details
Closed on
Aug 14, 1997
Sold by
Mann Randy and Mann Gwen
Bought by
Thornton Johnny
Purchase Details
Closed on
Oct 21, 1988
Sold by
Ray Mrs T C
Bought by
Mann Randy and Mann Gwen
Purchase Details
Closed on
Aug 1, 1978
Bought by
Ray Mrs T C
Create a Home Valuation Report for This Property
The Home Valuation Report is an in-depth analysis detailing your home's value as well as a comparison with similar homes in the area
Home Values in the Area
Average Home Value in this Area
Purchase History
| Date | Buyer | Sale Price | Title Company |
|---|---|---|---|
| Zervas Dino | -- | -- | |
| Jackson Alphonso* | $41,100 | -- | |
| Cendant Mortgage Corp* | $41,100 | -- | |
| Thornton Johnny | $39,500 | -- | |
| Mann Randy | $31,800 | -- | |
| Ray Mrs T C | -- | -- |
Source: Public Records
Tax History Compared to Growth
Tax History
| Year | Tax Paid | Tax Assessment Tax Assessment Total Assessment is a certain percentage of the fair market value that is determined by local assessors to be the total taxable value of land and additions on the property. | Land | Improvement |
|---|---|---|---|---|
| 2025 | $717 | $20,000 | $2,000 | $18,000 |
| 2024 | $717 | $33,638 | $2,000 | $31,638 |
| 2023 | $750 | $32,060 | $2,000 | $30,060 |
| 2022 | $529 | $30,354 | $2,000 | $28,354 |
| 2021 | $518 | $28,648 | $2,000 | $26,648 |
| 2020 | $563 | $28,648 | $2,000 | $26,648 |
| 2019 | $813 | $28,648 | $2,000 | $26,648 |
| 2018 | $413 | $23,176 | $8,000 | $15,176 |
| 2017 | $941 | $23,176 | $8,000 | $15,176 |
| 2016 | $414 | $23,176 | $8,000 | $15,176 |
| 2015 | -- | $23,176 | $8,000 | $15,176 |
| 2014 | -- | $23,176 | $8,000 | $15,176 |
| 2013 | -- | $23,175 | $8,000 | $15,175 |
Source: Public Records
Map
Nearby Homes