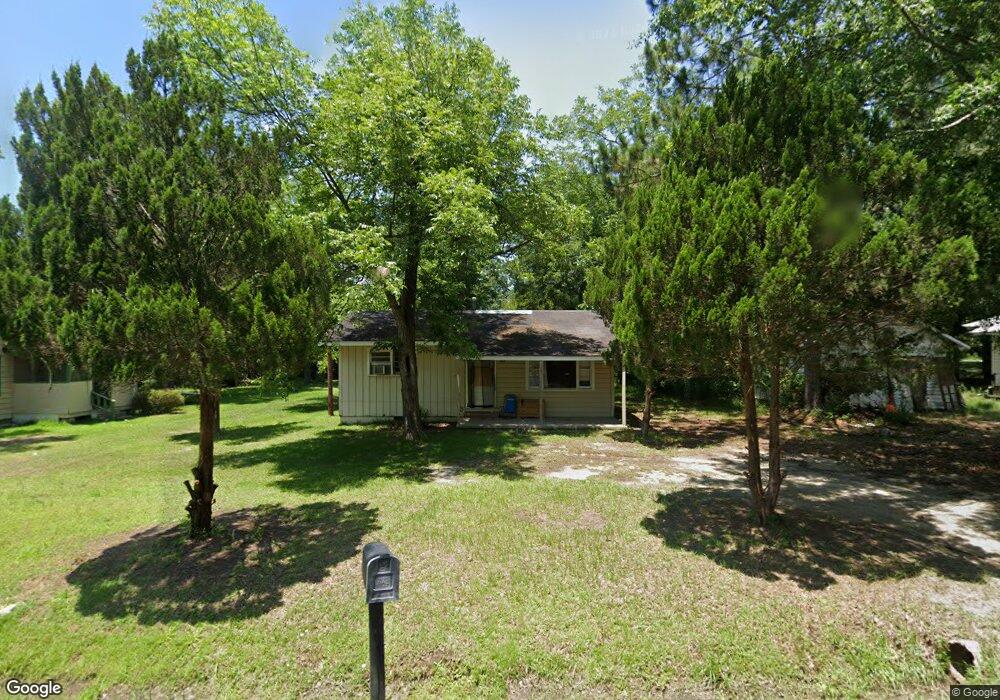
311 E 6th Ave Cordele, GA 31015
Estimated Value: $62,521 - $82,000
2
Beds
1
Bath
950
Sq Ft
$76/Sq Ft
Est. Value
About This Home
This home is located at 311 E 6th Ave, Cordele, GA 31015 and is currently estimated at $72,380, approximately $76 per square foot. 311 E 6th Ave is a home located in Crisp County with nearby schools including Crisp County Elementary School, Crisp County Primary School, and Crisp County Middle School.
Ownership History
Date
Name
Owned For
Owner Type
Purchase Details
Closed on
May 21, 2013
Sold by
Colony Bank
Bought by
Daniels Thad
Current Estimated Value
Purchase Details
Closed on
May 22, 2012
Sold by
Open Portals Llc
Bought by
Colony Bank
Purchase Details
Closed on
Sep 17, 2007
Sold by
Jesake Llc
Bought by
Open Portals Llc
Purchase Details
Closed on
Dec 31, 2003
Sold by
Rice James M
Bought by
Jesake Llc
Purchase Details
Closed on
May 13, 2002
Sold by
Pate Sandra C
Bought by
Rice James M
Purchase Details
Closed on
May 2, 1994
Sold by
Gee Royce and Gee Guy
Bought by
Pate Felton P
Purchase Details
Closed on
Dec 19, 1991
Sold by
Hargrove Betty Etal
Bought by
Gee Royce and Gee Guy
Purchase Details
Closed on
Jul 31, 1991
Bought by
Hargrove Betty Etal
Create a Home Valuation Report for This Property
The Home Valuation Report is an in-depth analysis detailing your home's value as well as a comparison with similar homes in the area
Home Values in the Area
Average Home Value in this Area
Purchase History
| Date | Buyer | Sale Price | Title Company |
|---|---|---|---|
| Daniels Thad | $15,000 | -- | |
| Colony Bank | -- | -- | |
| Open Portals Llc | $160,000 | -- | |
| Jesake Llc | -- | -- | |
| Rice James M | $85,000 | -- | |
| Pate Sandra C | -- | -- | |
| Pate Felton P | $17,000 | -- | |
| Gee Royce | $15,000 | -- | |
| Hargrove Betty Etal | -- | -- |
Source: Public Records
Tax History Compared to Growth
Tax History
| Year | Tax Paid | Tax Assessment Tax Assessment Total Assessment is a certain percentage of the fair market value that is determined by local assessors to be the total taxable value of land and additions on the property. | Land | Improvement |
|---|---|---|---|---|
| 2025 | $639 | $19,691 | $1,500 | $18,191 |
| 2024 | $639 | $17,840 | $1,500 | $16,340 |
| 2023 | $634 | $16,915 | $1,500 | $15,415 |
| 2022 | $423 | $15,989 | $1,500 | $14,489 |
| 2021 | $414 | $15,064 | $1,500 | $13,564 |
| 2020 | $424 | $15,064 | $1,500 | $13,564 |
| 2019 | $427 | $15,064 | $1,500 | $13,564 |
| 2018 | $289 | $9,798 | $1,800 | $7,998 |
| 2017 | $398 | $9,798 | $1,800 | $7,998 |
| 2016 | $290 | $9,798 | $1,800 | $7,998 |
| 2015 | -- | $9,798 | $1,800 | $7,998 |
| 2014 | -- | $9,798 | $1,800 | $7,998 |
| 2013 | -- | $7,257 | $1,800 | $5,457 |
Source: Public Records
Map
Nearby Homes