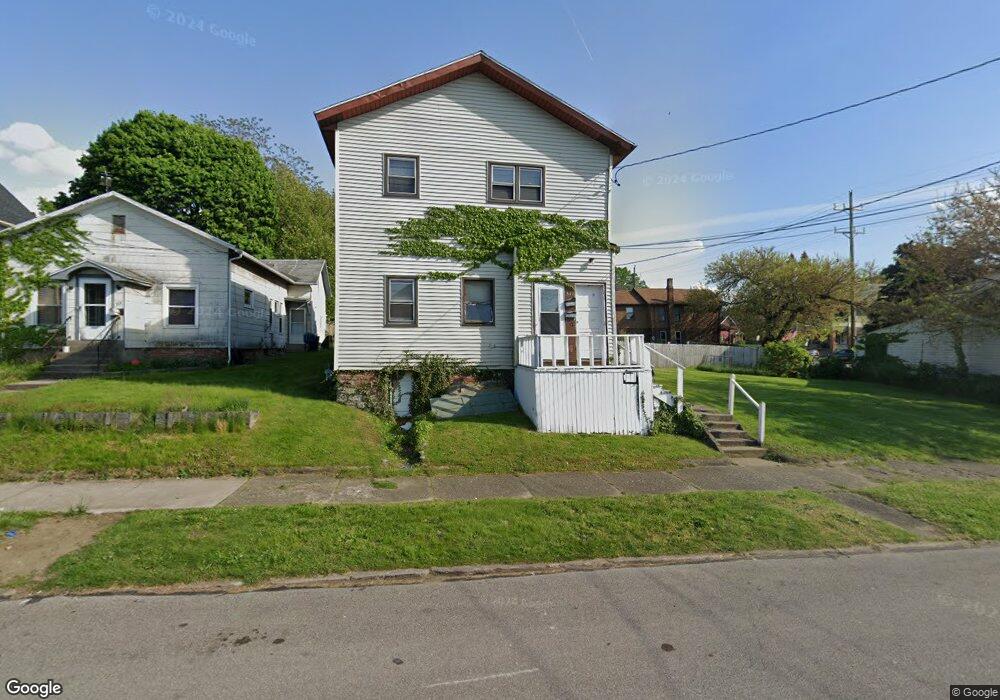
311 E 7th St Erie, PA 16503
East Bayfront NeighborhoodEstimated Value: $98,000 - $150,000
--
Bed
--
Bath
4,292
Sq Ft
$28/Sq Ft
Est. Value
About This Home
This home is located at 311 E 7th St, Erie, PA 16503 and is currently estimated at $119,667, approximately $27 per square foot. 311 E 7th St is a home located in Erie County with nearby schools including Pfeiffer-Burleigh Elementary School, East Middle School, and Erie High School.
Ownership History
Date
Name
Owned For
Owner Type
Purchase Details
Closed on
Nov 18, 2024
Sold by
Eastward Venture Llc and Eastward Ventures Llc
Bought by
East Side Renaissance Holdings Llc
Current Estimated Value
Purchase Details
Closed on
Dec 23, 2021
Sold by
Dawson Edward C and Dawson Ferita C
Bought by
Eastward Ventures Llc
Purchase Details
Closed on
Dec 27, 2007
Sold by
Rastatter Gerald A and Rastatter Regina M
Bought by
Dawson Edward C and Dawson Ferita Collins
Home Financials for this Owner
Home Financials are based on the most recent Mortgage that was taken out on this home.
Original Mortgage
$28,125
Interest Rate
5.94%
Mortgage Type
Purchase Money Mortgage
Create a Home Valuation Report for This Property
The Home Valuation Report is an in-depth analysis detailing your home's value as well as a comparison with similar homes in the area
Home Values in the Area
Average Home Value in this Area
Purchase History
| Date | Buyer | Sale Price | Title Company |
|---|---|---|---|
| East Side Renaissance Holdings Llc | -- | None Listed On Document | |
| East Side Renaissance Holdings Llc | -- | None Listed On Document | |
| Eastward Ventures Llc | $192,000 | None Available | |
| Dawson Edward C | $37,500 | None Available |
Source: Public Records
Mortgage History
| Date | Status | Borrower | Loan Amount |
|---|---|---|---|
| Previous Owner | Dawson Edward C | $28,125 |
Source: Public Records
Tax History Compared to Growth
Tax History
| Year | Tax Paid | Tax Assessment Tax Assessment Total Assessment is a certain percentage of the fair market value that is determined by local assessors to be the total taxable value of land and additions on the property. | Land | Improvement |
|---|---|---|---|---|
| 2025 | $3,292 | $83,272 | $14,100 | $69,172 |
| 2024 | $3,222 | $83,272 | $14,100 | $69,172 |
| 2023 | $3,130 | $83,272 | $14,100 | $69,172 |
| 2022 | $1,472 | $40,000 | $14,100 | $25,900 |
| 2021 | $1,451 | $40,000 | $14,100 | $25,900 |
| 2020 | $1,441 | $40,000 | $14,100 | $25,900 |
| 2019 | $1,366 | $40,000 | $14,100 | $25,900 |
| 2018 | $1,350 | $40,000 | $14,100 | $25,900 |
| 2017 | $1,347 | $40,000 | $14,100 | $25,900 |
| 2016 | $1,513 | $40,000 | $14,100 | $25,900 |
| 2015 | $1,503 | $40,000 | $14,100 | $25,900 |
| 2014 | $1,296 | $40,000 | $14,100 | $25,900 |
Source: Public Records
Map
Nearby Homes