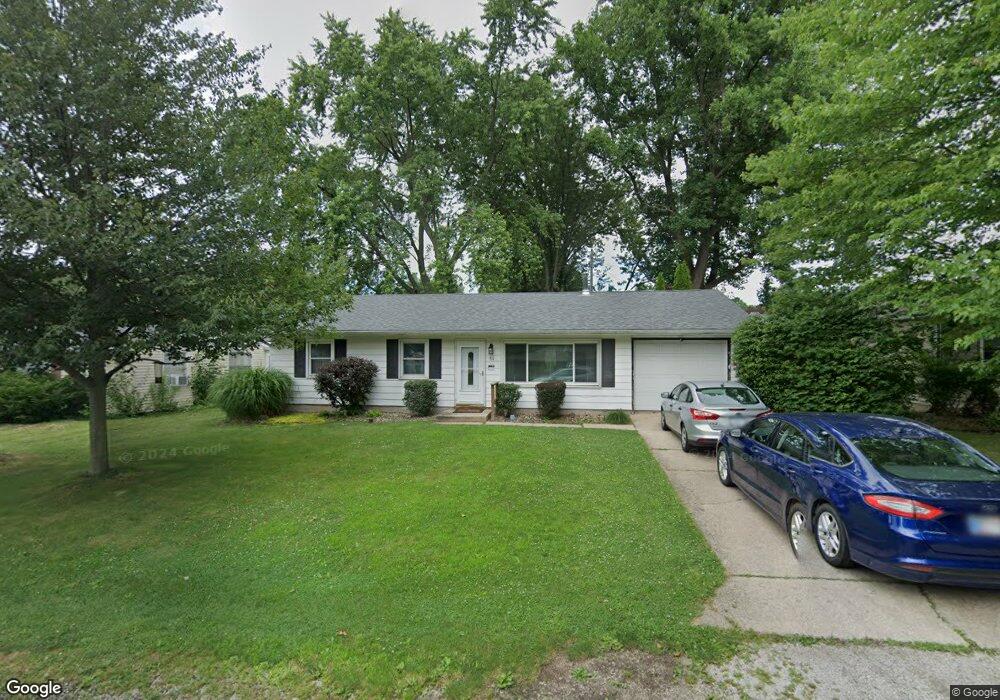
311 E 9th St La Porte, IN 46350
Estimated Value: $154,000 - $173,000
3
Beds
2
Baths
1,092
Sq Ft
$148/Sq Ft
Est. Value
About This Home
This home is located at 311 E 9th St, La Porte, IN 46350 and is currently estimated at $161,923, approximately $148 per square foot. 311 E 9th St is a home located in LaPorte County with nearby schools including Dunkerton Elementary School, Handley Elementary School, and La Porte High School.
Ownership History
Date
Name
Owned For
Owner Type
Purchase Details
Closed on
Sep 15, 2021
Sold by
Kincannon Myrn Jean
Bought by
Kincannon Myrn Jean and Neary Joel Christian
Current Estimated Value
Purchase Details
Closed on
Aug 29, 2014
Sold by
Zmuda Jeffrey A and Zmuda Laura S
Bought by
Gushrowski Vickie L
Home Financials for this Owner
Home Financials are based on the most recent Mortgage that was taken out on this home.
Original Mortgage
$130,591
Interest Rate
4.1%
Mortgage Type
FHA
Create a Home Valuation Report for This Property
The Home Valuation Report is an in-depth analysis detailing your home's value as well as a comparison with similar homes in the area
Home Values in the Area
Average Home Value in this Area
Purchase History
| Date | Buyer | Sale Price | Title Company |
|---|---|---|---|
| Kincannon Myrn Jean | -- | None Listed On Document | |
| Gushrowski Vickie L | -- | Fidelity Natl Title Ins Co |
Source: Public Records
Mortgage History
| Date | Status | Borrower | Loan Amount |
|---|---|---|---|
| Previous Owner | Gushrowski Vickie L | $130,591 |
Source: Public Records
Tax History Compared to Growth
Tax History
| Year | Tax Paid | Tax Assessment Tax Assessment Total Assessment is a certain percentage of the fair market value that is determined by local assessors to be the total taxable value of land and additions on the property. | Land | Improvement |
|---|---|---|---|---|
| 2024 | $2,033 | $107,400 | $13,200 | $94,200 |
| 2022 | $388 | $87,800 | $11,000 | $76,800 |
| 2021 | $238 | $81,200 | $11,000 | $70,200 |
| 2020 | $64 | $81,200 | $11,000 | $70,200 |
| 2019 | $158 | $71,500 | $12,800 | $58,700 |
| 2018 | $84 | $63,400 | $10,200 | $53,200 |
| 2017 | $91 | $63,000 | $10,200 | $52,800 |
| 2016 | $77 | $61,500 | $8,900 | $52,600 |
| 2014 | $92 | $58,200 | $8,900 | $49,300 |
Source: Public Records
Map
Nearby Homes