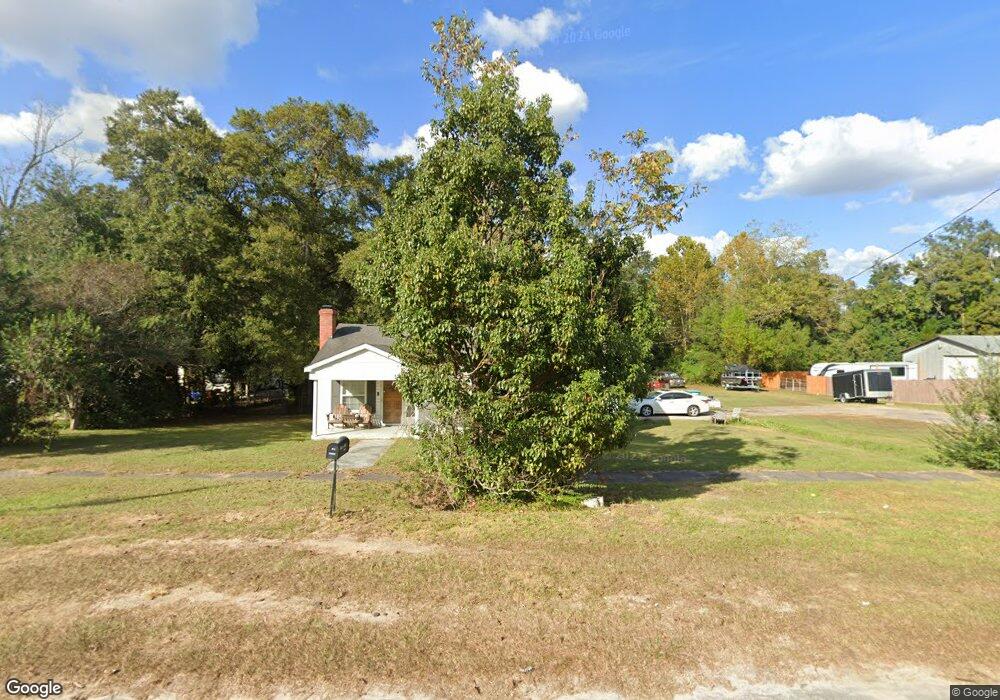
311 E Iowa Ave Bonifay, FL 32425
Estimated Value: $121,000 - $137,989
3
Beds
1
Bath
1,348
Sq Ft
$97/Sq Ft
Est. Value
About This Home
This home is located at 311 E Iowa Ave, Bonifay, FL 32425 and is currently estimated at $130,997, approximately $97 per square foot. 311 E Iowa Ave is a home located in Holmes County with nearby schools including Bethlehem High School, Bonifay K-8 School, and Ponce de Leon Elementary School.
Ownership History
Date
Name
Owned For
Owner Type
Purchase Details
Closed on
Mar 28, 2016
Sold by
Pettis James Michael and Pettis Rebecca A
Bought by
Johnson Vaughn F
Current Estimated Value
Home Financials for this Owner
Home Financials are based on the most recent Mortgage that was taken out on this home.
Original Mortgage
$65,000
Outstanding Balance
$51,588
Interest Rate
3.65%
Mortgage Type
VA
Estimated Equity
$79,409
Purchase Details
Closed on
Feb 21, 2014
Sold by
Pettis James Michael and Pettis Rebecc A
Bought by
Pettis James Michael and Pettis Rebecca A
Purchase Details
Closed on
Feb 5, 2014
Sold by
Pettis Billy R
Bought by
Pettis James Michael
Purchase Details
Closed on
May 30, 2000
Sold by
Arnold William J and Arnold Elizabeth A
Bought by
Pettis Billy J and Pettis Delena
Home Financials for this Owner
Home Financials are based on the most recent Mortgage that was taken out on this home.
Original Mortgage
$40,000
Interest Rate
9.5%
Create a Home Valuation Report for This Property
The Home Valuation Report is an in-depth analysis detailing your home's value as well as a comparison with similar homes in the area
Home Values in the Area
Average Home Value in this Area
Purchase History
| Date | Buyer | Sale Price | Title Company |
|---|---|---|---|
| Johnson Vaughn F | $65,000 | Panhandle Land Title Llc | |
| Pettis James Michael | -- | Attorney | |
| Pettis James Michael | -- | Attorney | |
| Peltin James Michael | -- | None Available | |
| Pettis Billy J | $55,000 | Bonifay Abstract & Title Co |
Source: Public Records
Mortgage History
| Date | Status | Borrower | Loan Amount |
|---|---|---|---|
| Open | Johnson Vaughn F | $65,000 | |
| Previous Owner | Pettis Billy J | $40,000 |
Source: Public Records
Tax History Compared to Growth
Tax History
| Year | Tax Paid | Tax Assessment Tax Assessment Total Assessment is a certain percentage of the fair market value that is determined by local assessors to be the total taxable value of land and additions on the property. | Land | Improvement |
|---|---|---|---|---|
| 2024 | -- | $64,787 | -- | -- |
| 2023 | $0 | $62,900 | $0 | $0 |
| 2022 | $0 | $61,068 | $0 | $0 |
| 2021 | $0 | $59,289 | $0 | $0 |
| 2020 | $0 | $58,470 | $3,920 | $54,550 |
| 2019 | $0 | $58,470 | $3,920 | $54,550 |
| 2018 | $0 | $57,885 | $3,920 | $53,965 |
| 2017 | $75 | $57,885 | $3,920 | $53,965 |
| 2016 | $938 | $57,885 | $0 | $0 |
| 2015 | -- | $53,513 | $0 | $0 |
| 2014 | -- | $52,418 | $0 | $0 |
Source: Public Records
Map
Nearby Homes
- 607 E Nebraska Ave
- 402 E Pennsylvania Ave
- 2480 Homestead Rd
- 00 Florida 79
- 000 Florida 79
- 1115 N Waukesha St
- 110 W Michigan Ave
- 111 E Wisconsin Ave
- 503 N Tracy St
- 308 S Depot St
- XXX Hwy 79 Unit Lot 7
- XXX Hwy 79 Unit Lot 5
- XXX Hwy 79 Unit Lot 4
- XX1 Highway 177a
- 703 S Weeks St
- 000 Highway 90
- 1204 N Waukesha St
- 402 Hatcher Dr
- 1002 S Weeks St
- Hawthorne Trail
- 177 N State St
- 173 N State St
- 301 E Iowa Ave
- 305 E Iowa Ave
- 401 E Iowa Ave
- 312 E Iowa Ave
- 308 E Iowa Ave
- 402 E Iowa Ave
- 302 E Iowa Ave
- 408 E Iowa Ave
- 311 E Nebraska Ave
- 401 N Hubbard St
- 409 N Hubbard St
- 307 E Nebraska Ave
- 401 E Nebraska Ave
- 311 N Varner St
- 412 E Iowa Ave
- 301 E Nebraska Ave
- 405 E Nebraska Ave
- 504 N Varner St