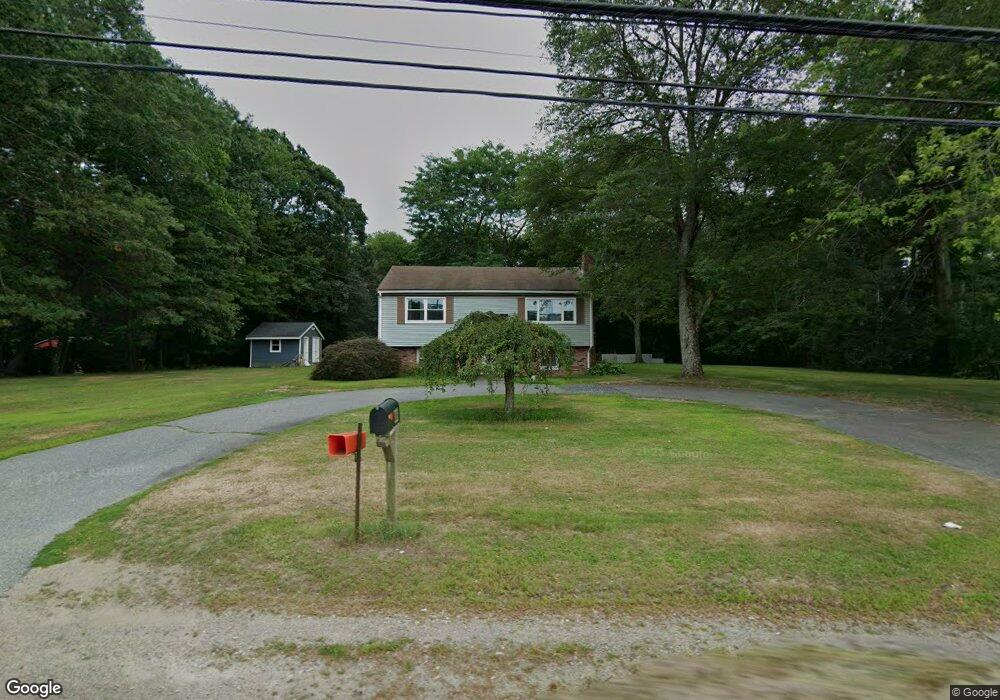
311 E Main St Norton, MA 02766
Norton AreaEstimated Value: $498,847 - $596,000
About This Home
This home is located at 311 E Main St, Norton, MA 02766 and is currently estimated at $531,212, approximately $609 per square foot. 311 E Main St is a home located in Bristol County with nearby schools including L.G. Nourse Elementary School, Henri A. Yelle Elementary School, and Norton Middle School.
Ownership History
We collect this data history from publicly available records. To have your information removed, we recommend requesting removal directly through your county’s website.
Purchase Details
Purchase Details
Home Values in the Area
Average Home Value in this Area
Purchase History
We collect this data history from publicly available records. To have your information removed, we recommend requesting removal directly through your county’s website.
| Date | Buyer | Sale Price | Title Company |
|---|---|---|---|
| -- | None Available | ||
| $255,000 | -- |
Mortgage History
We collect this data history from publicly available records. To have your information removed, we recommend requesting removal directly through your county’s website.
| Date | Status | Borrower | Loan Amount |
|---|---|---|---|
| Previous Owner | $30,000 | ||
| Previous Owner | $190,600 | ||
| Previous Owner | $15,000 | ||
| Previous Owner | $50,000 |
Tax History
We collect this data history from publicly available records. To have your information removed, we recommend requesting removal directly through your county’s website.
| Year | Tax Paid | Tax Assessment Tax Assessment Total Assessment is a certain percentage of the fair market value that is determined by local assessors to be the total taxable value of land and additions on the property. | Land | Improvement |
|---|---|---|---|---|
| 2025 | $51 | $389,800 | $148,000 | $241,800 |
| 2024 | $4,751 | $366,900 | $140,900 | $226,000 |
| 2023 | $4,536 | $349,200 | $132,900 | $216,300 |
| 2022 | $4,359 | $305,700 | $120,800 | $184,900 |
| 2021 | $5,062 | $276,700 | $115,100 | $161,600 |
| 2020 | $4,008 | $270,800 | $111,700 | $159,100 |
| 2019 | $4,733 | $252,200 | $107,500 | $144,700 |
| 2018 | $3,649 | $240,700 | $107,500 | $133,200 |
| 2017 | $4,162 | $227,100 | $107,500 | $119,600 |
| 2016 | $3,381 | $216,600 | $107,500 | $109,100 |
| 2015 | $3,261 | $211,900 | $105,300 | $106,600 |
| 2014 | $3,106 | $202,100 | $100,300 | $101,800 |
Map
- 4 Canoe River Rd
- 283 E Main St Unit 34
- 18 Downing Dr
- 1 Wilbur Terrace Unit 6
- 88 Newcomb St
- 96 Burt St
- 0 Knollwood & 0 Rear Kensington
- 108 Norton Ave Unit 4
- 14 Kendall Park
- 5 Kensington Rd
- 0 Kensington Rd
- 195 E Main St
- 14 Appleblossom Ln
- 145 Burt St Unit 2
- 165 Norton Ave Unit 5
- 0 Burt St
- 210 Bay Rd
- 5 Sierra Dr
- 6 Thoreau Dr
- 46 Pinebrook Ln Unit 3
Ask me questions while you tour the home.