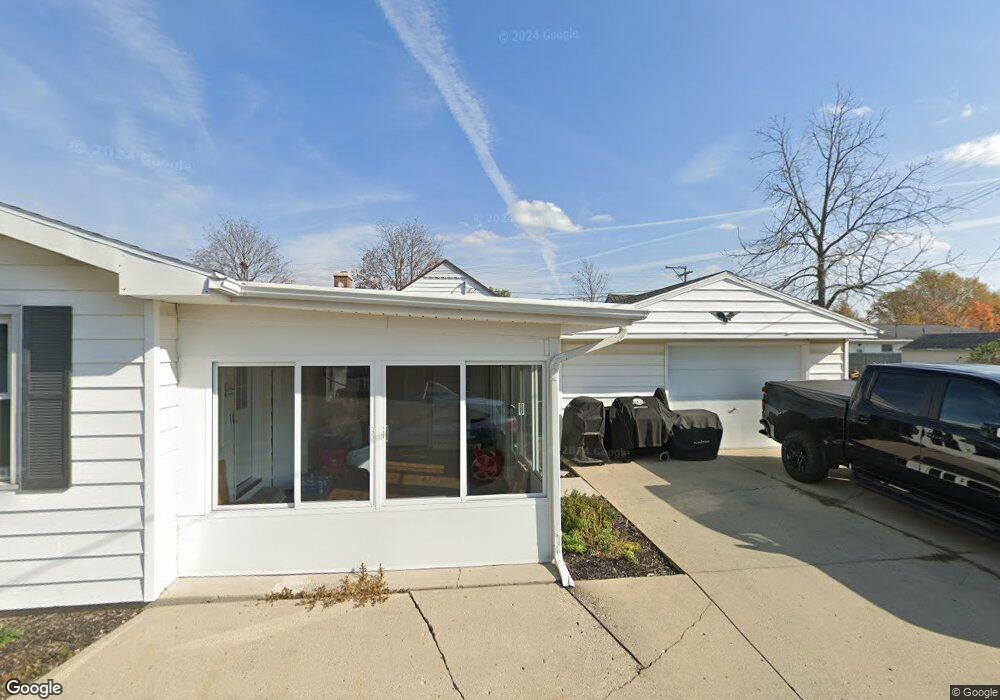
311 E Mechanic St Wapakoneta, OH 45895
Estimated Value: $233,000 - $248,000
4
Beds
2
Baths
2,279
Sq Ft
$106/Sq Ft
Est. Value
About This Home
This home is located at 311 E Mechanic St, Wapakoneta, OH 45895 and is currently estimated at $242,265, approximately $106 per square foot. 311 E Mechanic St is a home located in Auglaize County with nearby schools including Wapakoneta Elementary School, Wapakoneta High School, and Wapakoneta Middle School.
Ownership History
Date
Name
Owned For
Owner Type
Purchase Details
Closed on
May 13, 2025
Sold by
Patterson Suzzanne L
Bought by
Patterson Suzzanne L and Patterson Jeremy A
Current Estimated Value
Purchase Details
Closed on
Apr 1, 2020
Sold by
Steiner Barbara Lh
Bought by
Steiner Barbara Lh and Patterson Suzanne L
Purchase Details
Closed on
Dec 6, 2019
Sold by
Hittepole Scott E and Hittepole Melissa
Bought by
Steiner Barbara Lh
Home Financials for this Owner
Home Financials are based on the most recent Mortgage that was taken out on this home.
Original Mortgage
$64,000
Interest Rate
3.75%
Mortgage Type
Purchase Money Mortgage
Purchase Details
Closed on
Nov 29, 1999
Sold by
Berg Egon
Bought by
Hittepole Scott E
Purchase Details
Closed on
Jan 22, 1999
Sold by
Berg Egon
Bought by
Berg Egon
Create a Home Valuation Report for This Property
The Home Valuation Report is an in-depth analysis detailing your home's value as well as a comparison with similar homes in the area
Home Values in the Area
Average Home Value in this Area
Purchase History
| Date | Buyer | Sale Price | Title Company |
|---|---|---|---|
| Patterson Suzzanne L | -- | None Listed On Document | |
| Patterson Suzzanne L | -- | None Listed On Document | |
| Patterson Suzzanne L | -- | None Listed On Document | |
| Patterson Suzzanne L | -- | None Listed On Document | |
| Steiner Barbara Lh | -- | None Available | |
| Steiner Barbara Lh | $169,000 | None Available | |
| Hittepole Scott E | $100,000 | -- | |
| Berg Egon | -- | -- |
Source: Public Records
Mortgage History
| Date | Status | Borrower | Loan Amount |
|---|---|---|---|
| Previous Owner | Steiner Barbara Lh | $64,000 |
Source: Public Records
Tax History Compared to Growth
Tax History
| Year | Tax Paid | Tax Assessment Tax Assessment Total Assessment is a certain percentage of the fair market value that is determined by local assessors to be the total taxable value of land and additions on the property. | Land | Improvement |
|---|---|---|---|---|
| 2024 | $3,329 | $68,290 | $12,240 | $56,050 |
| 2023 | $1,929 | $68,290 | $12,240 | $56,050 |
| 2022 | $1,513 | $51,540 | $11,220 | $40,320 |
| 2021 | $1,473 | $51,540 | $11,220 | $40,320 |
| 2020 | $1,497 | $51,542 | $11,218 | $40,324 |
| 2019 | $1,542 | $42,400 | $9,230 | $33,170 |
| 2018 | $1,547 | $42,400 | $9,230 | $33,170 |
| 2017 | $1,539 | $42,400 | $9,230 | $33,170 |
| 2016 | $1,403 | $38,735 | $8,656 | $30,079 |
| 2015 | $1,384 | $38,735 | $8,656 | $30,079 |
| 2014 | $1,398 | $38,735 | $8,656 | $30,079 |
| 2013 | $1,795 | $38,735 | $8,656 | $30,079 |
Source: Public Records
Map
Nearby Homes
- 201 E Pearl St
- 409 S Pine St
- 9 E Silver St
- 0 Ohio 67
- 307 W Auglaize St
- 608 W Benton St
- 102 Wapak St
- 420 Hoopengarner St
- 814 W Benton St
- 322 Cole Dr
- 0 Wapakoneta Cridersville Rd
- 106 Valleyview Dr
- 808 Aster Dr
- 1100 W Auglaize St
- 920 Primrose Dr
- 601 Warren St
- 1028 Stonegate Ct
- 1020 Timber Trail
- 17092 Hauss Rd