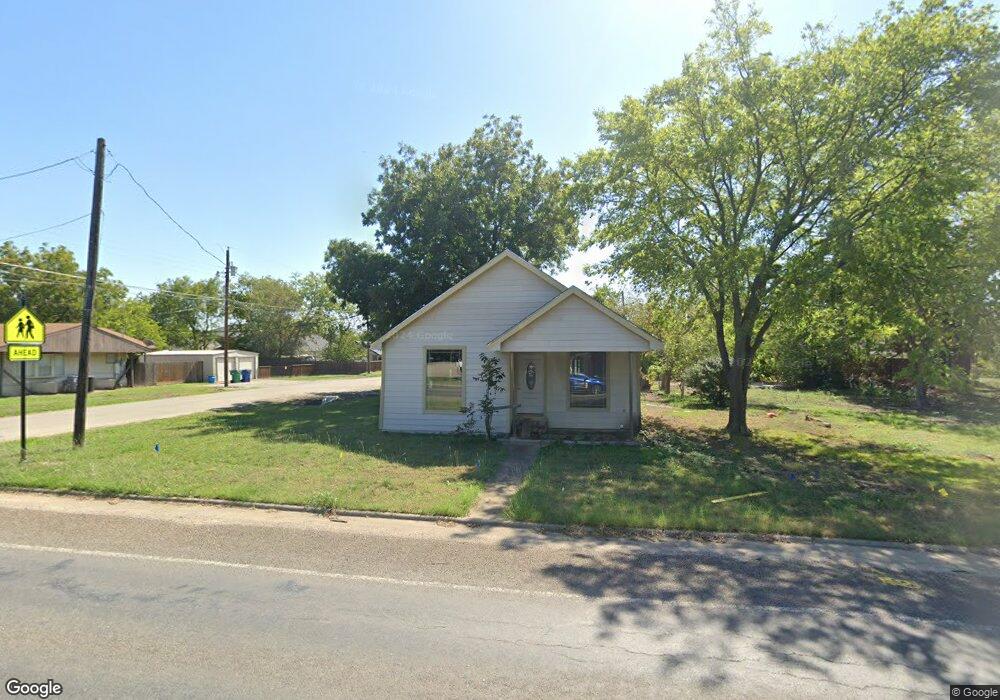
311 E Pecan St Celina, TX 75009
Estimated Value: $303,000 - $396,000
2
Beds
1
Bath
1,008
Sq Ft
$349/Sq Ft
Est. Value
About This Home
This home is located at 311 E Pecan St, Celina, TX 75009 and is currently estimated at $351,312, approximately $348 per square foot. 311 E Pecan St is a home located in Collin County with nearby schools including Celina Primary School, Moore Middle School, and Celina High School.
Ownership History
Date
Name
Owned For
Owner Type
Purchase Details
Closed on
Apr 3, 2025
Sold by
Hester Michael Gene
Bought by
Smith Christina Leann
Current Estimated Value
Purchase Details
Closed on
Mar 4, 2024
Sold by
Llamas Rafael
Bought by
Llamas Juan
Purchase Details
Closed on
Oct 5, 2023
Sold by
Llamas Juan and Llamas Veronica
Bought by
Llamas Rafael and Llamas Juan
Purchase Details
Closed on
Feb 11, 2013
Sold by
Read Paul M
Bought by
Llamas Juan and Zapata Veronica
Home Financials for this Owner
Home Financials are based on the most recent Mortgage that was taken out on this home.
Original Mortgage
$48,000
Interest Rate
3.39%
Mortgage Type
Seller Take Back
Purchase Details
Closed on
Jun 16, 1994
Sold by
Brooks V B and Brooks Helen O
Bought by
Read Paul M
Home Financials for this Owner
Home Financials are based on the most recent Mortgage that was taken out on this home.
Original Mortgage
$12,000
Interest Rate
8.75%
Create a Home Valuation Report for This Property
The Home Valuation Report is an in-depth analysis detailing your home's value as well as a comparison with similar homes in the area
Home Values in the Area
Average Home Value in this Area
Purchase History
| Date | Buyer | Sale Price | Title Company |
|---|---|---|---|
| Smith Christina Leann | -- | None Listed On Document | |
| Llamas Juan | -- | Chicago Title | |
| Llamas Rafael | -- | Chicago Title | |
| Llamas Juan | -- | Ornt | |
| Read Paul M | -- | -- |
Source: Public Records
Mortgage History
| Date | Status | Borrower | Loan Amount |
|---|---|---|---|
| Previous Owner | Llamas Juan | $48,000 | |
| Previous Owner | Read Paul M | $12,000 |
Source: Public Records
Tax History
| Year | Tax Paid | Tax Assessment Tax Assessment Total Assessment is a certain percentage of the fair market value that is determined by local assessors to be the total taxable value of land and additions on the property. | Land | Improvement |
|---|---|---|---|---|
| 2025 | $8,652 | $429,204 | $369,171 | $60,033 |
| 2024 | $5,882 | $284,925 | $221,503 | $63,422 |
| 2023 | $5,882 | $200,874 | $140,285 | $60,589 |
| 2022 | $4,137 | $180,506 | $73,834 | $106,672 |
| 2021 | $2,456 | $105,178 | $24,000 | $81,178 |
| 2020 | $811 | $33,097 | $24,000 | $9,097 |
| 2019 | $833 | $32,694 | $24,000 | $8,694 |
| 2018 | $856 | $33,488 | $24,000 | $9,488 |
| 2017 | $854 | $33,402 | $24,000 | $9,402 |
| 2016 | $1,429 | $55,500 | $50,000 | $5,500 |
| 2015 | $1,390 | $54,172 | $50,000 | $4,172 |
Source: Public Records
Map
Nearby Homes
- 403 E Pecan St
- 309 E Walnut St
- 212 E Walnut St
- 504 E Pecan St
- 312 E Main St
- 406 E Maple St
- 1128 Wheatgrass Mews
- 410 N Texas St
- 307 S New Mexico St
- 0 E Oak St
- 511 E Elm St
- 309 S Louisiana St
- Lot 2 Louisiana
- Lot 1 Louisiana
- 416 Dover Mews
- 220 Chestnut St
- 305 N Arizona Dr
- 300 Chestnut St
- 407 W Maple St
- 101 Chestnut St
- 309 E Pecan St
- 400 E Pecan St
- 408 E Pecan St
- 305 E Pecan St
- 312 E Walnut St
- 310 E Walnut St
- 308 E Walnut St
- 200 N New Mexico St
- 402 E Walnut St
- 306 E Walnut St
- 111 N Oklahoma Dr
- 404 E Walnut St
- 402 E Pecan St
- 304 E Walnut St
- 100 E Walnut St
- 406 E Walnut St
- 406 E Pecan St
- 302 E Walnut St
- 409 E Pecan St
- 311 E Walnut St
Your Personal Tour Guide
Ask me questions while you tour the home.