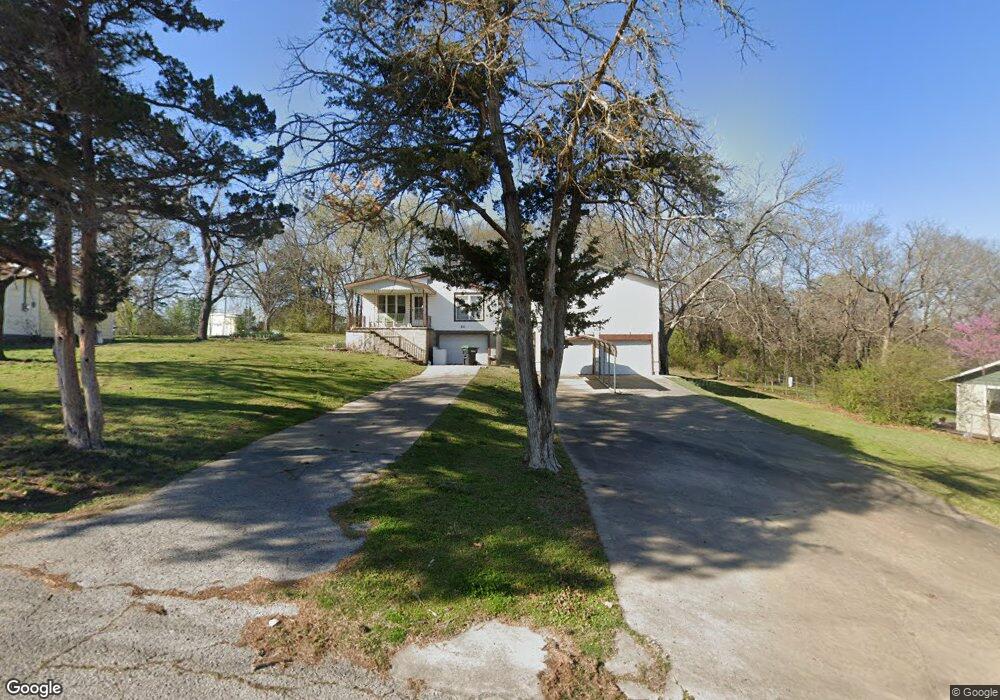
311 E South St Tahlequah, OK 74464
Estimated Value: $152,000 - $178,000
3
Beds
2
Baths
1,308
Sq Ft
$126/Sq Ft
Est. Value
About This Home
This home is located at 311 E South St, Tahlequah, OK 74464 and is currently estimated at $165,000, approximately $126 per square foot. 311 E South St is a home located in Cherokee County with nearby schools including Greenwood Elementary School, Cherokee Elementary School, and Tahlequah Middle School.
Ownership History
Date
Name
Owned For
Owner Type
Purchase Details
Closed on
May 1, 2024
Sold by
Hendricks Crystal Brook and Hendricks Chad Stephen
Bought by
Hendricks Crystal Brook and Hendricks Chad Stephen
Current Estimated Value
Purchase Details
Closed on
Apr 1, 2019
Sold by
Page Marvin W and Page Paula
Bought by
Page Barbara Theresa and Page Hicks Barbara T
Purchase Details
Closed on
Jul 31, 2017
Sold by
Hendricks Crystal and Marvin Page Trust
Bought by
Page Marvin Wayne and Page Barbara Theresa
Purchase Details
Closed on
Dec 9, 2015
Sold by
Page Marvin L and Pager Marvin Leon
Bought by
The Marvin Page Trust
Purchase Details
Closed on
Aug 30, 1993
Sold by
Page Helen
Bought by
Page Marvin Leon and Page Barba
Create a Home Valuation Report for This Property
The Home Valuation Report is an in-depth analysis detailing your home's value as well as a comparison with similar homes in the area
Home Values in the Area
Average Home Value in this Area
Purchase History
| Date | Buyer | Sale Price | Title Company |
|---|---|---|---|
| Hendricks Crystal Brook | -- | None Listed On Document | |
| Page Barbara Theresa | -- | None Available | |
| Page Marvin Wayne | -- | None Available | |
| The Marvin Page Trust | -- | None Available | |
| Page Marvin Leon | -- | -- | |
| Page Marvin Leon | -- | None Available |
Source: Public Records
Tax History Compared to Growth
Tax History
| Year | Tax Paid | Tax Assessment Tax Assessment Total Assessment is a certain percentage of the fair market value that is determined by local assessors to be the total taxable value of land and additions on the property. | Land | Improvement |
|---|---|---|---|---|
| 2025 | $569 | $7,215 | $1,150 | $6,065 |
| 2024 | $569 | $7,005 | $855 | $6,150 |
| 2023 | $569 | $6,801 | $853 | $5,948 |
| 2022 | $520 | $6,603 | $828 | $5,775 |
| 2021 | $504 | $6,411 | $804 | $5,607 |
| 2020 | $495 | $6,225 | $781 | $5,444 |
| 2019 | $474 | $6,044 | $758 | $5,286 |
| 2018 | $463 | $5,867 | $823 | $5,044 |
| 2017 | $446 | $5,696 | $799 | $4,897 |
| 2016 | $432 | $5,530 | $776 | $4,754 |
| 2015 | $397 | $5,370 | $780 | $4,590 |
| 2014 | $397 | $5,213 | $798 | $4,415 |
Source: Public Records
Map
Nearby Homes
- 201 Sandy Cir
- 306 Short St
- 757 S Bluff Ave
- 528 S Muskogee Ave
- 413 Greenwood Dr
- 403 S Bluff Ave
- 508 Covington Place
- 215 S Maple Ave
- 802 S College Ave
- 510 S Cherokee Ave
- 605 S Oak Ave
- 821 S College Ave
- 224 W Chickasaw St
- 281 Redbud Ln
- 513 S State Ave
- 720 S East Ave
- 1105 S Maple Ave
- 104 Tommye Ln
- 516 W Fox St
- 321 W Shawnee St