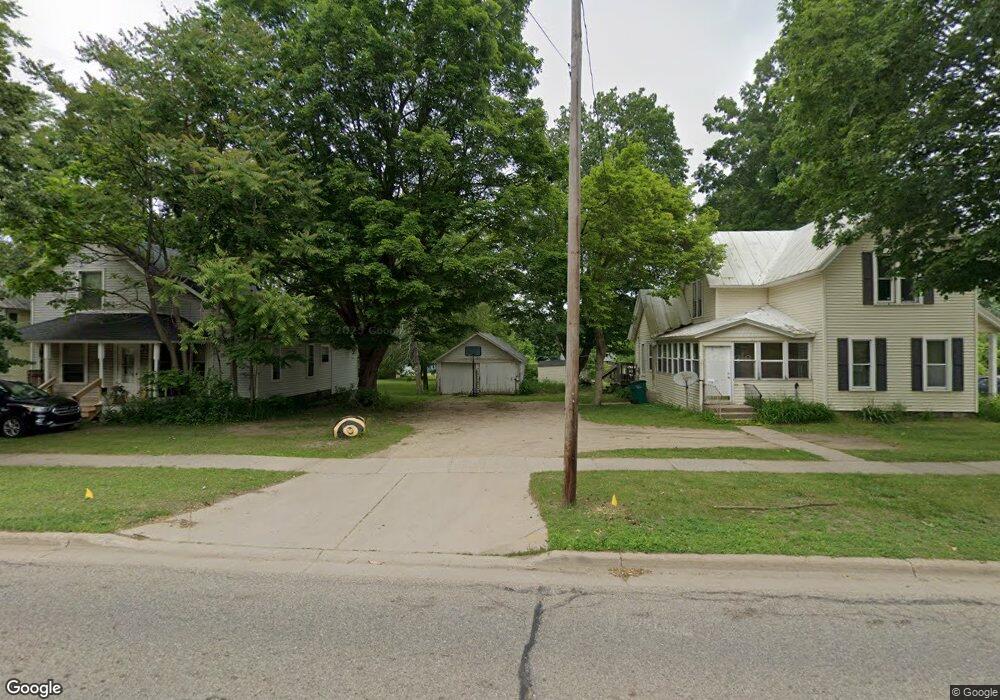
311 E Superior St Wayland, MI 49348
Estimated Value: $273,094 - $310,000
4
Beds
1
Bath
1,768
Sq Ft
$165/Sq Ft
Est. Value
About This Home
This home is located at 311 E Superior St, Wayland, MI 49348 and is currently estimated at $291,274, approximately $164 per square foot. 311 E Superior St is a home located in Allegan County with nearby schools including Wayland High School, St. Therese Catholic School, and St. Stanislaus School.
Ownership History
Date
Name
Owned For
Owner Type
Purchase Details
Closed on
Dec 11, 2009
Sold by
Apex Invesments Of Michigan Inc
Bought by
Parker Jennifer R and Smith William J
Current Estimated Value
Home Financials for this Owner
Home Financials are based on the most recent Mortgage that was taken out on this home.
Original Mortgage
$67,500
Outstanding Balance
$44,298
Interest Rate
5.02%
Mortgage Type
New Conventional
Estimated Equity
$246,976
Purchase Details
Closed on
Jun 30, 2008
Sold by
311 Superior Land Trust and Wierenga Eric W
Bought by
Apex Investments Of Michigan Inc
Purchase Details
Closed on
Nov 3, 2005
Sold by
Smith Kelly and Williamson John T
Bought by
Haas Leland Frank
Home Financials for this Owner
Home Financials are based on the most recent Mortgage that was taken out on this home.
Original Mortgage
$92,500
Interest Rate
8.54%
Mortgage Type
Fannie Mae Freddie Mac
Purchase Details
Closed on
Apr 17, 2002
Sold by
Williamson Hugh T
Bought by
The Hugh T Williamson Revocable Trust
Create a Home Valuation Report for This Property
The Home Valuation Report is an in-depth analysis detailing your home's value as well as a comparison with similar homes in the area
Home Values in the Area
Average Home Value in this Area
Purchase History
| Date | Buyer | Sale Price | Title Company |
|---|---|---|---|
| Parker Jennifer R | $67,500 | Lighthouse Title Inc | |
| Apex Investments Of Michigan Inc | $50,000 | Triunion Title | |
| Haas Leland Frank | -- | Michigan Title | |
| The Hugh T Williamson Revocable Trust | -- | -- |
Source: Public Records
Mortgage History
| Date | Status | Borrower | Loan Amount |
|---|---|---|---|
| Open | Parker Jennifer R | $67,500 | |
| Previous Owner | Haas Leland Frank | $92,500 |
Source: Public Records
Tax History Compared to Growth
Tax History
| Year | Tax Paid | Tax Assessment Tax Assessment Total Assessment is a certain percentage of the fair market value that is determined by local assessors to be the total taxable value of land and additions on the property. | Land | Improvement |
|---|---|---|---|---|
| 2025 | $2,180 | $118,500 | $24,500 | $94,000 |
| 2024 | $1,982 | $106,300 | $19,700 | $86,600 |
| 2023 | $1,982 | $76,900 | $16,400 | $60,500 |
| 2022 | $1,982 | $67,000 | $15,000 | $52,000 |
| 2021 | $1,854 | $61,000 | $14,400 | $46,600 |
| 2020 | $1,854 | $57,500 | $14,400 | $43,100 |
| 2019 | $0 | $55,400 | $14,400 | $41,000 |
| 2018 | $0 | $51,100 | $14,400 | $36,700 |
| 2017 | $0 | $51,200 | $14,400 | $36,800 |
| 2016 | $0 | $43,500 | $14,400 | $29,100 |
| 2015 | -- | $43,500 | $14,400 | $29,100 |
| 2014 | -- | $39,200 | $14,400 | $24,800 |
| 2013 | -- | $37,500 | $14,400 | $23,100 |
Source: Public Records
Map
Nearby Homes
- 212 E Superior St
- 146 Hanlon Ct
- 110 E Sycamore St
- 621 S Main St
- 545 N Main St
- 219 Alpine St
- 319 Alpine St
- 330 Lotz Ct
- 835 Wild Flower Ct
- 3610 Garden St
- 1143 Regina Trail
- 3570 Windsor Woods Dr
- 3685 Calkins Ct
- 3282 Stonehill Ct
- 3770 Division Ave S
- 3296 Stonehill Ct
- 4674 12th St
- 3214 7th St
- 3897 Division St
- 3669 Kalamazoo Dr
- 321 E Superior St
- 312 E Superior St
- 303 E Superior St
- 304 E Superior St
- 229 E Superior St
- 327 E Superior St
- 223 E Superior St
- 320 E Superior St
- 222 E Superior St
- 215 E Superior St
- 328 E Superior St
- 328 E Superior St Unit Upper
- 328 E Superior St Unit 3281/
- 119 S Locust St
- 337 E Superior St
- 314 E Maple St
- 312 E Maple St
- 336 E Superior St
- 316 E Maple St
- 228 E Maple St