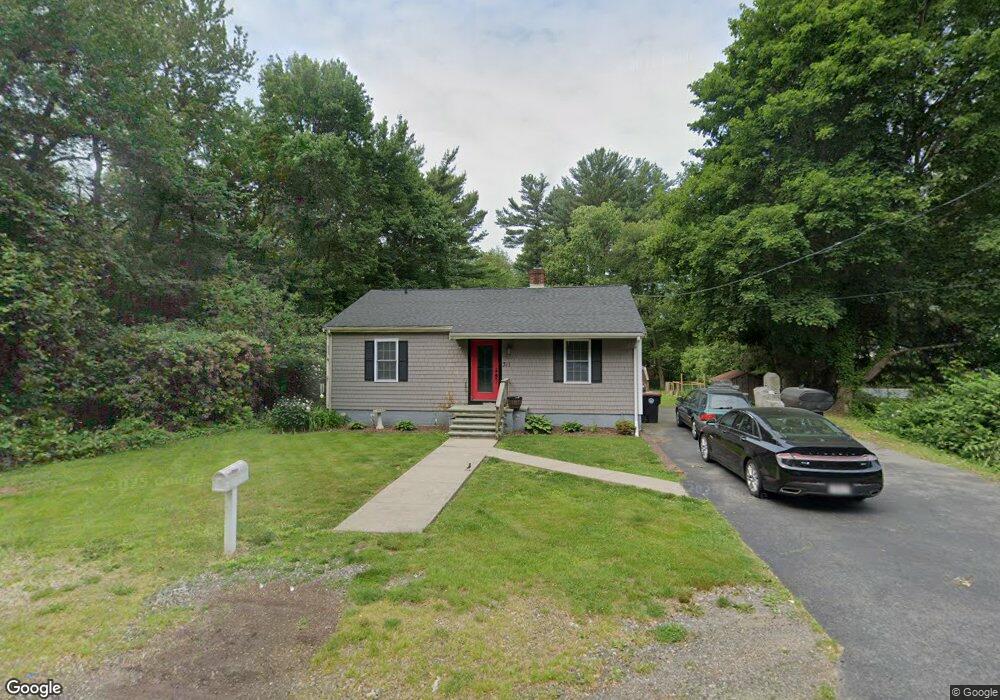
311 East St Brockton, MA 02302
Estimated Value: $507,831 - $550,000
4
Beds
2
Baths
1,572
Sq Ft
$332/Sq Ft
Est. Value
About This Home
This home is located at 311 East St, Brockton, MA 02302 and is currently estimated at $522,208, approximately $332 per square foot. 311 East St is a home located in Plymouth County with nearby schools including Davis K-8 School, John F. Kennedy Elementary School, and South Middle School.
Ownership History
Date
Name
Owned For
Owner Type
Purchase Details
Closed on
Jan 17, 2012
Sold by
Mcavoy Robert L
Bought by
Mcavoy Kerrianne
Current Estimated Value
Purchase Details
Closed on
Jul 31, 2006
Sold by
Specialty Mgmt Svcs Lp
Bought by
Mcavoy Robert L and Mcavoy Kerrianne
Home Financials for this Owner
Home Financials are based on the most recent Mortgage that was taken out on this home.
Original Mortgage
$243,200
Interest Rate
6.67%
Mortgage Type
Purchase Money Mortgage
Purchase Details
Closed on
May 13, 2002
Sold by
Hite Andrew A and Byrne-Hite Dorothy
Bought by
Specialty Mgmt Svcs Lp
Home Financials for this Owner
Home Financials are based on the most recent Mortgage that was taken out on this home.
Original Mortgage
$198,320
Interest Rate
7.18%
Mortgage Type
Purchase Money Mortgage
Purchase Details
Closed on
Aug 24, 2001
Sold by
Hite Andrew A and Byrne-Hite Dorothy
Bought by
East St Rt
Create a Home Valuation Report for This Property
The Home Valuation Report is an in-depth analysis detailing your home's value as well as a comparison with similar homes in the area
Home Values in the Area
Average Home Value in this Area
Purchase History
| Date | Buyer | Sale Price | Title Company |
|---|---|---|---|
| Mcavoy Kerrianne | -- | -- | |
| Mcavoy Robert L | $304,000 | -- | |
| Specialty Mgmt Svcs Lp | $247,900 | -- | |
| East St Rt | $60,000 | -- |
Source: Public Records
Mortgage History
| Date | Status | Borrower | Loan Amount |
|---|---|---|---|
| Previous Owner | East St Rt | $243,200 | |
| Previous Owner | East St Rt | $60,800 | |
| Previous Owner | East St Rt | $198,320 |
Source: Public Records
Tax History Compared to Growth
Tax History
| Year | Tax Paid | Tax Assessment Tax Assessment Total Assessment is a certain percentage of the fair market value that is determined by local assessors to be the total taxable value of land and additions on the property. | Land | Improvement |
|---|---|---|---|---|
| 2025 | $5,212 | $430,400 | $177,300 | $253,100 |
| 2024 | $5,176 | $430,600 | $177,300 | $253,300 |
| 2023 | $4,962 | $382,300 | $130,000 | $252,300 |
| 2022 | $4,620 | $330,700 | $118,200 | $212,500 |
| 2021 | $4,224 | $291,300 | $105,200 | $186,100 |
| 2020 | $4,466 | $294,800 | $91,700 | $203,100 |
| 2019 | $4,298 | $276,600 | $87,700 | $188,900 |
| 2018 | $3,806 | $237,000 | $87,700 | $149,300 |
| 2017 | $3,568 | $221,600 | $87,700 | $133,900 |
| 2016 | $3,661 | $210,900 | $84,100 | $126,800 |
| 2015 | $3,262 | $179,700 | $84,100 | $95,600 |
| 2014 | $3,089 | $170,400 | $84,100 | $86,300 |
Source: Public Records
Map
Nearby Homes