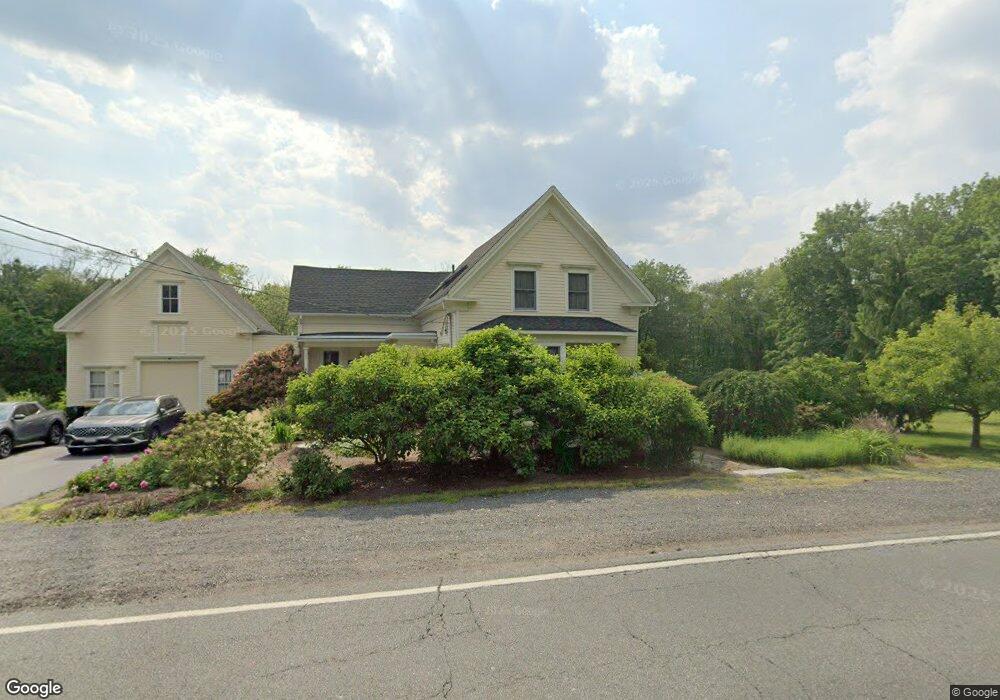
311 East St West Bridgewater, MA 02379
Estimated Value: $606,000 - $719,000
4
Beds
2
Baths
1,841
Sq Ft
$352/Sq Ft
Est. Value
About This Home
This home is located at 311 East St, West Bridgewater, MA 02379 and is currently estimated at $648,105, approximately $352 per square foot. 311 East St is a home located in Plymouth County with nearby schools including Spring Street Elementary School, Howard Elementary School, and Rose L. MacDonald Elementary School.
Ownership History
Date
Name
Owned For
Owner Type
Purchase Details
Closed on
Feb 27, 2024
Sold by
Fox David B and Fox Janice C
Bought by
Janice C Fox T C and Janice Fox
Current Estimated Value
Purchase Details
Closed on
Dec 30, 2003
Sold by
Knox Mary H
Bought by
Fox David B and Fox Janice C
Home Financials for this Owner
Home Financials are based on the most recent Mortgage that was taken out on this home.
Original Mortgage
$212,000
Interest Rate
6.01%
Mortgage Type
Purchase Money Mortgage
Create a Home Valuation Report for This Property
The Home Valuation Report is an in-depth analysis detailing your home's value as well as a comparison with similar homes in the area
Home Values in the Area
Average Home Value in this Area
Purchase History
| Date | Buyer | Sale Price | Title Company |
|---|---|---|---|
| Janice C Fox T C | -- | None Available | |
| Janice C Fox T C | -- | None Available | |
| Fox David B | $350,000 | -- | |
| Fox David B | $350,000 | -- |
Source: Public Records
Mortgage History
| Date | Status | Borrower | Loan Amount |
|---|---|---|---|
| Previous Owner | Fox David B | $165,726 | |
| Previous Owner | Fox David B | $211,954 | |
| Previous Owner | Fox David B | $60,000 | |
| Previous Owner | Fox David B | $212,000 |
Source: Public Records
Tax History Compared to Growth
Tax History
| Year | Tax Paid | Tax Assessment Tax Assessment Total Assessment is a certain percentage of the fair market value that is determined by local assessors to be the total taxable value of land and additions on the property. | Land | Improvement |
|---|---|---|---|---|
| 2025 | $6,969 | $509,800 | $307,000 | $202,800 |
| 2024 | $6,851 | $483,500 | $285,300 | $198,200 |
| 2023 | $6,588 | $428,600 | $253,000 | $175,600 |
| 2022 | $6,485 | $399,800 | $242,100 | $157,700 |
| 2021 | $6,681 | $399,800 | $242,100 | $157,700 |
| 2020 | $6,545 | $399,800 | $242,100 | $157,700 |
| 2019 | $6,609 | $399,800 | $242,100 | $157,700 |
| 2018 | $6,613 | $386,700 | $233,400 | $153,300 |
| 2017 | $6,505 | $366,900 | $218,100 | $148,800 |
| 2016 | $6,415 | $356,400 | $207,600 | $148,800 |
| 2015 | $6,242 | $350,500 | $207,600 | $142,900 |
| 2014 | $5,780 | $350,500 | $207,600 | $142,900 |
Source: Public Records
Map
Nearby Homes
- 312 East St
- 320 East St
- 327 East St
- 328 East St
- 293 East St
- 294 East St
- 285 East St
- 285 East St Unit 1
- 332 East St
- 347 East St
- 259 East St
- 369 E Center St
- 12 Andrea Way
- 10 Andrea Way
- 20 Captain Carlson Way
- 18 Captain Carlson Way
- 15 Captain Carlson Way
- 18 Captain Carlson Way Unit 9
- 15 Captain Carlson Way Unit 27
- 15 Captain Carlson Way Unit 15