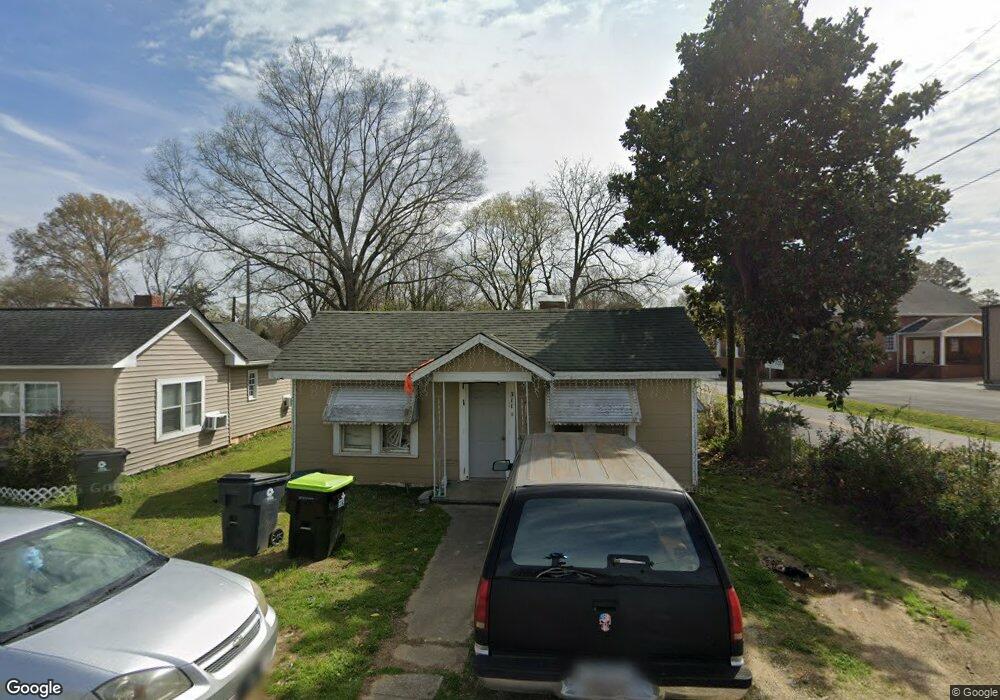
311 Edna St Cedartown, GA 30125
Estimated Value: $78,000 - $146,000
2
Beds
1
Bath
1,016
Sq Ft
$103/Sq Ft
Est. Value
About This Home
This home is located at 311 Edna St, Cedartown, GA 30125 and is currently estimated at $104,829, approximately $103 per square foot. 311 Edna St is a home located in Polk County with nearby schools including Cedar Christian School and Vineyard Harvester Christian Academy.
Ownership History
Date
Name
Owned For
Owner Type
Purchase Details
Closed on
Feb 13, 2018
Sold by
Segura Victor B
Bought by
Segura Juan and Segura Johana
Current Estimated Value
Purchase Details
Closed on
Jul 13, 2001
Sold by
Ingram David Kay and Ingram Jerry
Bought by
Segura Victor B
Purchase Details
Closed on
Mar 2, 2001
Sold by
Roberson Brad H and Roberson Melissa C
Bought by
Kay David and Jerry Ingram
Purchase Details
Closed on
Dec 29, 1998
Sold by
Roberson Lonzo G
Bought by
Roberson Brad H and Roberson Melissa C
Purchase Details
Closed on
Jun 11, 1997
Sold by
Shelton Carol Brown
Bought by
Roberson Lonzo G
Purchase Details
Closed on
May 28, 1992
Sold by
Shelton Charles H
Bought by
Shelton Carol Brown
Purchase Details
Closed on
Sep 18, 1967
Sold by
Lankford Frances M
Bought by
Shelton Charles H
Purchase Details
Closed on
Jan 1, 1957
Sold by
Mitchell Frances H
Bought by
Lankford Frances M
Purchase Details
Closed on
Sep 20, 1956
Bought by
Mitchell Frances H
Create a Home Valuation Report for This Property
The Home Valuation Report is an in-depth analysis detailing your home's value as well as a comparison with similar homes in the area
Home Values in the Area
Average Home Value in this Area
Purchase History
| Date | Buyer | Sale Price | Title Company |
|---|---|---|---|
| Segura Juan | -- | -- | |
| Segura Victor B | $34,000 | -- | |
| Kay David | $30,000 | -- | |
| Roberson Brad H | -- | -- | |
| Roberson Lonzo G | $34,000 | -- | |
| Shelton Carol Brown | -- | -- | |
| Shelton Charles H | -- | -- | |
| Lankford Frances M | -- | -- | |
| Mitchell Frances H | -- | -- |
Source: Public Records
Tax History Compared to Growth
Tax History
| Year | Tax Paid | Tax Assessment Tax Assessment Total Assessment is a certain percentage of the fair market value that is determined by local assessors to be the total taxable value of land and additions on the property. | Land | Improvement |
|---|---|---|---|---|
| 2024 | $556 | $17,602 | $1,152 | $16,450 |
| 2023 | $319 | $9,192 | $1,152 | $8,040 |
| 2022 | $191 | $8,052 | $1,152 | $6,900 |
| 2021 | $194 | $8,052 | $1,152 | $6,900 |
| 2020 | $194 | $8,052 | $1,152 | $6,900 |
| 2019 | $301 | $11,197 | $1,120 | $10,077 |
| 2018 | $291 | $10,578 | $840 | $9,738 |
| 2017 | $288 | $11,481 | $840 | $10,641 |
| 2016 | $312 | $11,481 | $840 | $10,641 |
| 2015 | $308 | $11,298 | $840 | $10,458 |
| 2014 | $311 | $11,298 | $840 | $10,458 |
Source: Public Records
Map
Nearby Homes
- 325 Fairview Ave
- 234 Brooks St
- 634 Georgia Ave
- 634 Georgia Ave Unit 123
- 151 W Ellawood Ave
- 2460 Hidden Creek Rd
- 149 Irwin St
- 129 W Ellawood Ave
- 729 S College St
- 1003 Fairview Ave
- 0 Philpot Springs Unit 10626665
- 129 Thompson St
- 226 Central St
- 217 E Gibson St
- 117 Cason Rd
- 119 Jackson St
- 328 330 Stubbs
- 203 Cason Rd
- 427 Park St
- 421 Wissahickon Ave