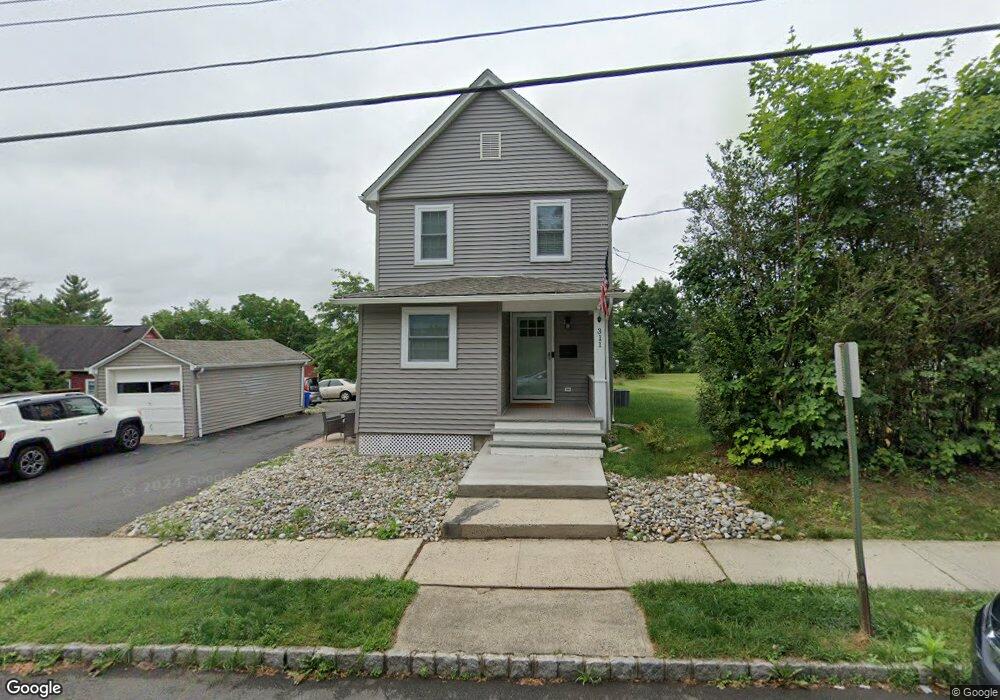
311 Elm St Stirling, NJ 07980
Estimated Value: $466,386 - $665,000
--
Bed
--
Bath
1,062
Sq Ft
$554/Sq Ft
Est. Value
About This Home
This home is located at 311 Elm St, Stirling, NJ 07980 and is currently estimated at $588,847, approximately $554 per square foot. 311 Elm St is a home located in Morris County with nearby schools including Gillette Elementary School, Millington Elementary School, and Central Middle School.
Ownership History
Date
Name
Owned For
Owner Type
Purchase Details
Closed on
Feb 21, 2020
Sold by
Tedesco John
Bought by
Tedesco Jessica and Arteaga Peter
Current Estimated Value
Home Financials for this Owner
Home Financials are based on the most recent Mortgage that was taken out on this home.
Original Mortgage
$308,000
Outstanding Balance
$272,191
Interest Rate
3.5%
Mortgage Type
New Conventional
Estimated Equity
$316,657
Purchase Details
Closed on
Sep 30, 2019
Sold by
Dorsi Robert J and Dorsi Robert J
Bought by
Tedesco John
Purchase Details
Closed on
Sep 24, 1992
Bought by
Dorsi Robert and Dorsi Stella
Create a Home Valuation Report for This Property
The Home Valuation Report is an in-depth analysis detailing your home's value as well as a comparison with similar homes in the area
Home Values in the Area
Average Home Value in this Area
Purchase History
| Date | Buyer | Sale Price | Title Company |
|---|---|---|---|
| Tedesco Jessica | $385,000 | Chicago Title Insurance Co | |
| Tedesco John | $170,000 | Chicago Title Insurance Co | |
| Dorsi Robert | -- | -- |
Source: Public Records
Mortgage History
| Date | Status | Borrower | Loan Amount |
|---|---|---|---|
| Open | Tedesco Jessica | $308,000 |
Source: Public Records
Tax History Compared to Growth
Tax History
| Year | Tax Paid | Tax Assessment Tax Assessment Total Assessment is a certain percentage of the fair market value that is determined by local assessors to be the total taxable value of land and additions on the property. | Land | Improvement |
|---|---|---|---|---|
| 2025 | $8,356 | $386,400 | $189,200 | $197,200 |
| 2024 | $8,127 | $372,700 | $184,200 | $188,500 |
| 2023 | $8,127 | $362,000 | $179,200 | $182,800 |
| 2022 | $7,791 | $345,200 | $169,200 | $176,000 |
| 2021 | $7,791 | $316,200 | $158,700 | $157,500 |
| 2020 | $6,986 | $288,300 | $158,700 | $129,600 |
| 2019 | $6,841 | $286,000 | $157,200 | $128,800 |
| 2018 | $6,686 | $281,400 | $154,200 | $127,200 |
| 2017 | $6,602 | $280,200 | $154,200 | $126,000 |
| 2016 | $6,532 | $278,200 | $154,200 | $124,000 |
| 2015 | $4,043 | $137,900 | $55,600 | $82,300 |
| 2014 | $3,955 | $137,900 | $55,600 | $82,300 |
Source: Public Records
Map
Nearby Homes