
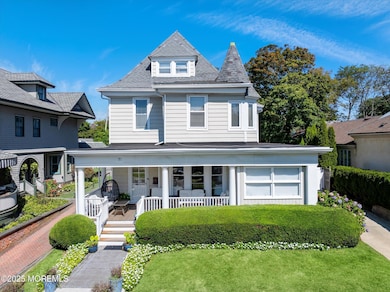
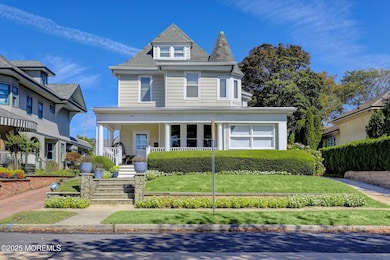
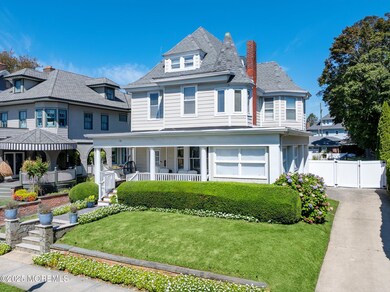
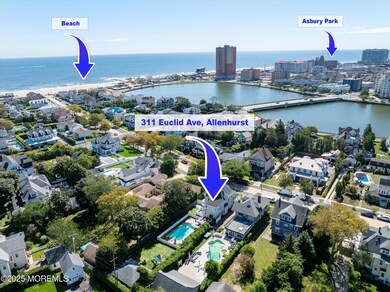
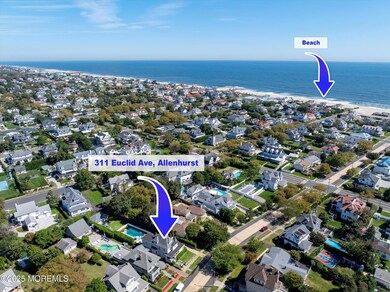
311 Euclid Ave Allenhurst, NJ 07711
Highlights
- Outdoor Pool
- 2 Car Detached Garage
- Central Air
- Colonial Architecture
About This Home
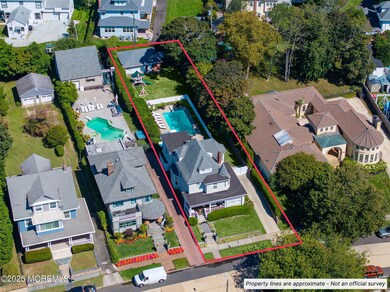
Welcome to this beautifully decorated 3-story colonial beach house, just one block from the ocean. Light and airy throughout, the home offers a true summer vibe with spacious living and dining areas, a chef's kitchen, and front and back porches to enjoy the summer breezes.
Relax by the pool or entertain on the charming front porch. With its prime beach town location and stylish coastal decor, this home is the ideal summer getaway.
Home Details
Home Type
- Single Family
Est. Annual Taxes
- $9,299
Year Built
- Built in 1908
Parking
- 2 Car Detached Garage
Home Design
- Colonial Architecture
Interior Spaces
- 2,501 Sq Ft Home
- 2-Story Property
- Basement Fills Entire Space Under The House
Bedrooms and Bathrooms
- 6 Bedrooms
- 2 Full Bathrooms
Utilities
- Central Air
- Heating System Uses Natural Gas
- Natural Gas Water Heater
Additional Features
- Outdoor Pool
- 0.26 Acre Lot
Listing and Financial Details
- Assessor Parcel Number 26-00003-0000-00006
Map
Source: MOREMLS (Monmouth Ocean Regional REALTORS®)
MLS Number: 22529202
APN: 26-00003-0000-00006
Disclaimer: Certain information contained herein is derived from information provided by parties other than Homes.com. All information provided is deemed reliable, but is not guaranteed to be accurate and should be independently verified.
![]() IDX information is provided exclusively for personal, non-commercial use, and may not be used for any purpose other than to identify prospective properties consumers may be interested in purchasing.
IDX information is provided exclusively for personal, non-commercial use, and may not be used for any purpose other than to identify prospective properties consumers may be interested in purchasing.
Information is deemed reliable but not guaranteed.
- 205 Edgemont Dr Unit 2
- 205 Edgemont Dr Unit 3
- 205 Edgemont Dr Unit 1
- 205 Edgemont Dr
- 312 Hume St
- 110A Corlies Ave
- 309 Hume St
- 15 Buena Vista Ct
- 400 Deal Lake Dr Unit 3J
- 400 Deal Lake Dr Unit 8F
- 400 Deal Lake Dr Unit 7H & 7G
- 400 Deal Lake Dr Unit 3K
- 400 Deal Lake Dr Unit 4G
- 400 Deal Lake Dr Unit 5F
- 400 Deal Lake Dr Unit 7J
- 400 Deal Lake Dr Unit 3F
- 500 Deal Lake Dr Unit 1E
- 500 Deal Lake Dr Unit 3B
- 315 Allen Ave
- 505 8th Ave
- 309 Hume St Unit B
- 406 Deal Lake Dr
- 500 Deal Lake Dr Unit 2B
- 310 Corlies Ave
- 317 8th Ave Unit 303
- 406 Lake Dr
- 404 Lake Dr
- 316 Spier Ave Unit 2
- 316 Spier Ave Unit 1
- 320 8th Ave Unit 1
- 316 8th Ave Unit 7
- 314 8th Ave Unit 2
- 200 Deal Lake Dr
- 125 Cedar Ave
- 211 Cedar Ave
- 704 8th Ave
- 512 7th Ave
- 703 7th Ave
- 705 7th Ave Unit 2
- 98 Neptune Ave
