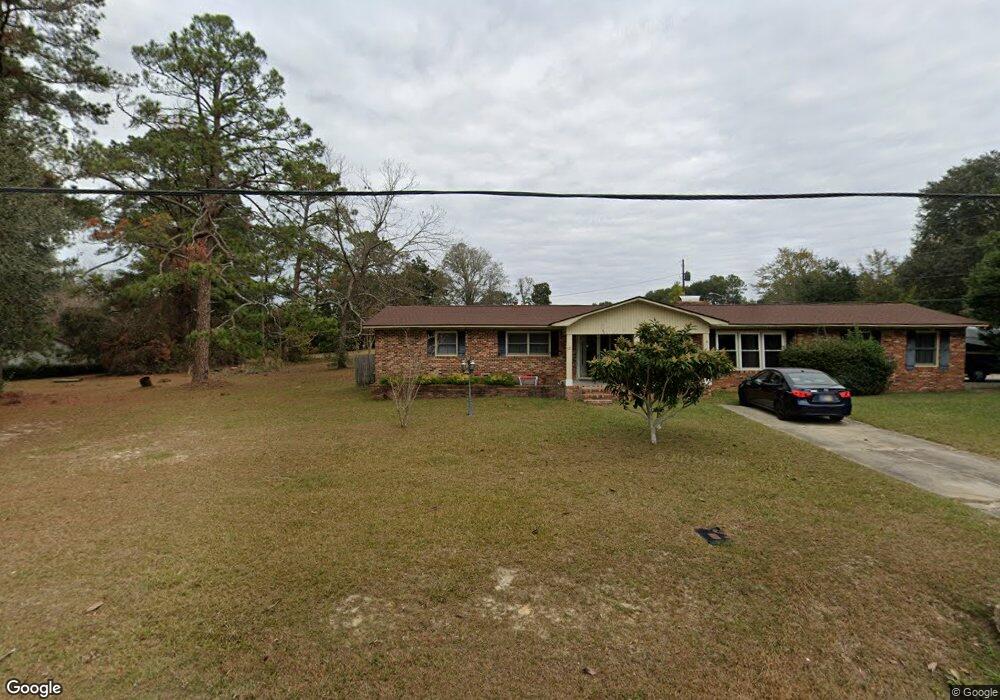
311 Fletcher Dr Statesboro, GA 30458
Estimated Value: $217,000 - $265,000
4
Beds
3
Baths
2,400
Sq Ft
$101/Sq Ft
Est. Value
About This Home
This home is located at 311 Fletcher Dr, Statesboro, GA 30458 and is currently estimated at $241,589, approximately $100 per square foot. 311 Fletcher Dr is a home located in Bulloch County with nearby schools including Mattie Lively Elementary School, Statesboro High School, and William James Middle School.
Ownership History
Date
Name
Owned For
Owner Type
Purchase Details
Closed on
Mar 7, 2022
Sold by
Hubbard Thomas L Estate
Bought by
Francisco Tara
Current Estimated Value
Home Financials for this Owner
Home Financials are based on the most recent Mortgage that was taken out on this home.
Original Mortgage
$123,250
Outstanding Balance
$114,853
Interest Rate
3.69%
Mortgage Type
Cash
Estimated Equity
$126,736
Purchase Details
Closed on
Apr 25, 2007
Sold by
Not Provided
Bought by
Hubbard Thomas L and Hubbard Elaine
Home Financials for this Owner
Home Financials are based on the most recent Mortgage that was taken out on this home.
Original Mortgage
$60,000
Interest Rate
6.11%
Mortgage Type
New Conventional
Purchase Details
Closed on
Jan 1, 2002
Bought by
Finch Darrell J
Purchase Details
Closed on
Oct 1, 2001
Bought by
Bankers Trust Company
Purchase Details
Closed on
Jul 1, 1994
Bought by
Morrison Michael J
Create a Home Valuation Report for This Property
The Home Valuation Report is an in-depth analysis detailing your home's value as well as a comparison with similar homes in the area
Home Values in the Area
Average Home Value in this Area
Purchase History
| Date | Buyer | Sale Price | Title Company |
|---|---|---|---|
| Francisco Tara | $145,000 | -- | |
| Hubbard Thomas L | $135,000 | -- | |
| Finch Darrell J | -- | -- | |
| Bankers Trust Company | -- | -- | |
| Morrison Michael J | -- | -- |
Source: Public Records
Mortgage History
| Date | Status | Borrower | Loan Amount |
|---|---|---|---|
| Open | Francisco Tara | $123,250 | |
| Previous Owner | Hubbard Thomas L | $60,000 |
Source: Public Records
Tax History Compared to Growth
Tax History
| Year | Tax Paid | Tax Assessment Tax Assessment Total Assessment is a certain percentage of the fair market value that is determined by local assessors to be the total taxable value of land and additions on the property. | Land | Improvement |
|---|---|---|---|---|
| 2024 | $2,139 | $78,040 | $10,000 | $68,040 |
| 2023 | $1,661 | $67,476 | $8,000 | $59,476 |
| 2022 | $1,259 | $64,189 | $8,000 | $56,189 |
| 2021 | $1,168 | $57,903 | $9,840 | $48,063 |
| 2020 | $1,148 | $55,337 | $9,840 | $45,497 |
| 2019 | $1,162 | $55,693 | $9,840 | $45,853 |
| 2018 | $1,068 | $49,064 | $9,840 | $39,224 |
| 2017 | $1,055 | $47,884 | $9,840 | $38,044 |
| 2016 | $1,047 | $46,332 | $9,840 | $36,492 |
| 2015 | $1,022 | $45,041 | $9,840 | $35,201 |
| 2014 | $939 | $45,041 | $9,840 | $35,201 |
Source: Public Records
Map
Nearby Homes
- 113 Nottingham Trail
- 113 Ladd Cir
- 108 Norwood Dr
- 823 N Main St
- 3 Friar Tuck Trail
- 405 N Main St
- 328 N Main St
- 118 Pin Oak Ln Unit 47
- 448 Myrtle Crossing Ln
- 318 N Main St
- 197 Zetterower Rd
- 17 E Parrish St
- 7 E Moore St
- 456 Myrtle Crossing Ln
- 11 W Moore St
- 0 Hwy 301 N Unit SA336320
- 0 Hwy 301 N Unit SA336324
- 117 Zetterower Rd
- 115 Zetterower Rd
- 113 Zetterower Rd
- 102 Hampton Ave
- 309 Fletcher Dr
- 101 Hampton Ave
- 313 Fletcher Dr
- 104 Hampton Ave
- 103 Hampton Ave
- 124 Nottingham Trail
- 307 Fletcher Dr
- 305 Fletcher Dr
- 315 Fletcher Dr
- 326 Fletcher Dr
- 306 Fletcher Dr
- 120 Nottingham Trail
- 316 Fletcher Dr
- 303 Fletcher Dr
- 102 Francis Scott Dr
- 115 Nottingham Trail
- 302 Fletcher Dr
- 312 Fletcher Dr
- 301 Fletcher Dr