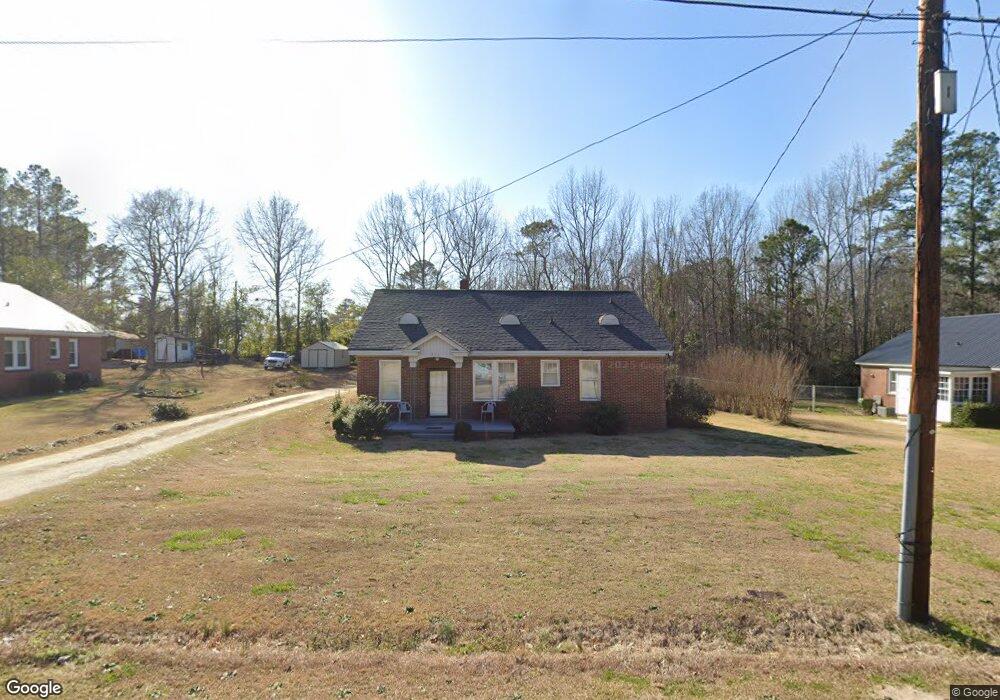
311 Grier Cir Thomson, GA 30824
Estimated Value: $177,368 - $202,000
3
Beds
2
Baths
1,386
Sq Ft
$139/Sq Ft
Est. Value
About This Home
This home is located at 311 Grier Cir, Thomson, GA 30824 and is currently estimated at $192,092, approximately $138 per square foot. 311 Grier Cir is a home located in McDuffie County with nearby schools including Thomson High School and Briarwood Academy.
Ownership History
Date
Name
Owned For
Owner Type
Purchase Details
Closed on
Jun 8, 2022
Sold by
Morris Nancy H
Bought by
Custodio Elizabeth Lanuza
Current Estimated Value
Home Financials for this Owner
Home Financials are based on the most recent Mortgage that was taken out on this home.
Original Mortgage
$159,953
Outstanding Balance
$151,803
Interest Rate
5.3%
Mortgage Type
New Conventional
Estimated Equity
$40,289
Purchase Details
Closed on
Nov 12, 2021
Sold by
Jones Robert W
Bought by
Morris Nancy H
Purchase Details
Closed on
May 5, 1983
Bought by
Jones Robert W
Create a Home Valuation Report for This Property
The Home Valuation Report is an in-depth analysis detailing your home's value as well as a comparison with similar homes in the area
Home Values in the Area
Average Home Value in this Area
Purchase History
| Date | Buyer | Sale Price | Title Company |
|---|---|---|---|
| Custodio Elizabeth Lanuza | $164,900 | -- | |
| Morris Nancy H | -- | -- | |
| Jones Robert W | $29,900 | -- |
Source: Public Records
Mortgage History
| Date | Status | Borrower | Loan Amount |
|---|---|---|---|
| Open | Custodio Elizabeth Lanuza | $159,953 |
Source: Public Records
Tax History Compared to Growth
Tax History
| Year | Tax Paid | Tax Assessment Tax Assessment Total Assessment is a certain percentage of the fair market value that is determined by local assessors to be the total taxable value of land and additions on the property. | Land | Improvement |
|---|---|---|---|---|
| 2025 | $1,780 | $61,742 | $3,608 | $58,134 |
| 2024 | $1,780 | $58,746 | $3,444 | $55,302 |
| 2023 | $1,752 | $56,358 | $3,280 | $53,078 |
| 2022 | $1,382 | $40,385 | $2,624 | $37,761 |
| 2021 | $468 | $32,991 | $3,280 | $29,711 |
| 2020 | $338 | $30,100 | $7,233 | $22,867 |
| 2019 | $342 | $30,100 | $7,233 | $22,867 |
| 2018 | $347 | $30,100 | $7,233 | $22,867 |
| 2017 | $454 | $33,585 | $7,233 | $26,352 |
| 2016 | $753 | $33,585 | $7,233 | $26,352 |
| 2015 | $656 | $33,585 | $7,233 | $26,352 |
| 2014 | $658 | $33,585 | $7,233 | $26,352 |
| 2013 | -- | $33,585 | $7,232 | $26,352 |
Source: Public Records
Map
Nearby Homes