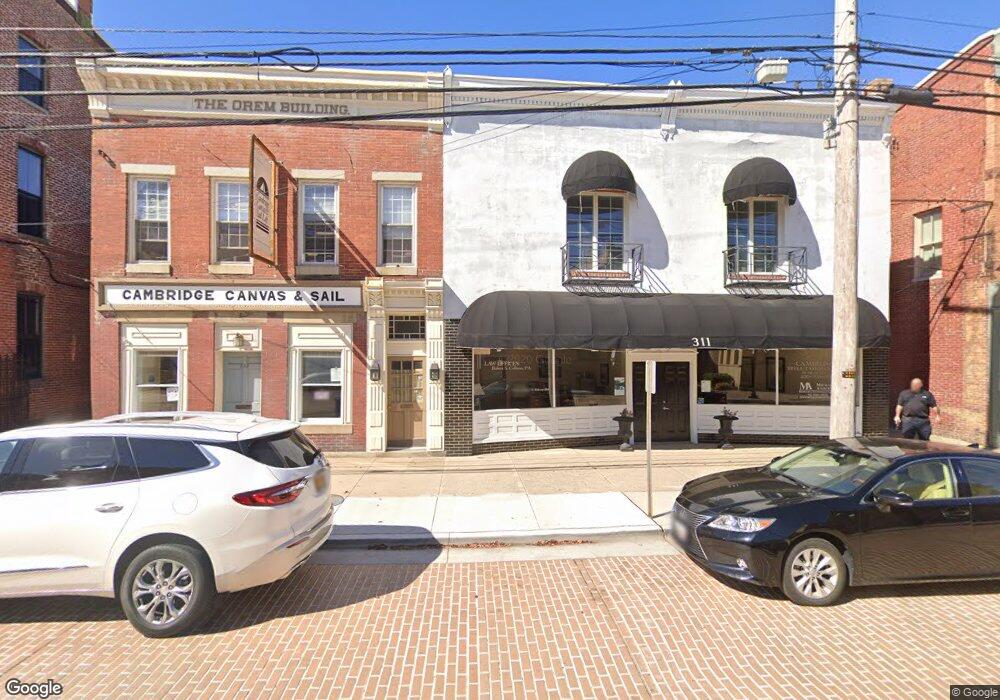
311 High St Cambridge, MD 21613
Estimated Value: $307,193
--
Bed
--
Bath
1,836
Sq Ft
$167/Sq Ft
Est. Value
About This Home
This home is located at 311 High St, Cambridge, MD 21613 and is currently estimated at $307,193, approximately $167 per square foot. 311 High St is a home located in Dorchester County with nearby schools including Choptank Elementary School, Mace's Lane Middle School, and Cambridge-South Dorchester High School.
Ownership History
Date
Name
Owned For
Owner Type
Purchase Details
Closed on
Jan 22, 2018
Sold by
Owens Bruce W and The Estate Of Bruce W Owens
Bought by
Owens Bruce W
Current Estimated Value
Purchase Details
Closed on
Oct 2, 2015
Sold by
Bryan Jacqueline K and Bryan James S
Bought by
Ibarra Jesusita L
Purchase Details
Closed on
Apr 29, 2005
Sold by
Collison Robert S
Bought by
Collison Robert S and Collison Cami L
Purchase Details
Closed on
Apr 7, 2004
Sold by
Carey Barbara L
Bought by
Collison Robery S
Create a Home Valuation Report for This Property
The Home Valuation Report is an in-depth analysis detailing your home's value as well as a comparison with similar homes in the area
Home Values in the Area
Average Home Value in this Area
Purchase History
| Date | Buyer | Sale Price | Title Company |
|---|---|---|---|
| Owens Bruce W | -- | None Available | |
| Ibarra Jesusita L | $35,000 | Cambridge Title Company | |
| Collison Robert S | -- | -- | |
| Collison Robery S | $388,100 | -- |
Source: Public Records
Tax History Compared to Growth
Tax History
| Year | Tax Paid | Tax Assessment Tax Assessment Total Assessment is a certain percentage of the fair market value that is determined by local assessors to be the total taxable value of land and additions on the property. | Land | Improvement |
|---|---|---|---|---|
| 2025 | $6,683 | $355,800 | $34,200 | $321,600 |
| 2024 | $6,332 | $349,200 | $0 | $0 |
| 2023 | $6,332 | $342,600 | $0 | $0 |
| 2022 | $6,210 | $336,000 | $34,200 | $301,800 |
| 2021 | $6,303 | $335,100 | $0 | $0 |
| 2020 | $6,303 | $334,200 | $0 | $0 |
| 2019 | $6,355 | $333,300 | $34,200 | $299,100 |
| 2018 | $7,465 | $402,067 | $0 | $0 |
| 2017 | $7,427 | $400,033 | $0 | $0 |
| 2016 | -- | $398,000 | $0 | $0 |
| 2015 | -- | $398,200 | $0 | $0 |
| 2014 | -- | $398,200 | $0 | $0 |
Source: Public Records
Map
Nearby Homes