Estimated Value: $400,659 - $426,000
3
Beds
2
Baths
2,110
Sq Ft
$195/Sq Ft
Est. Value
About This Home
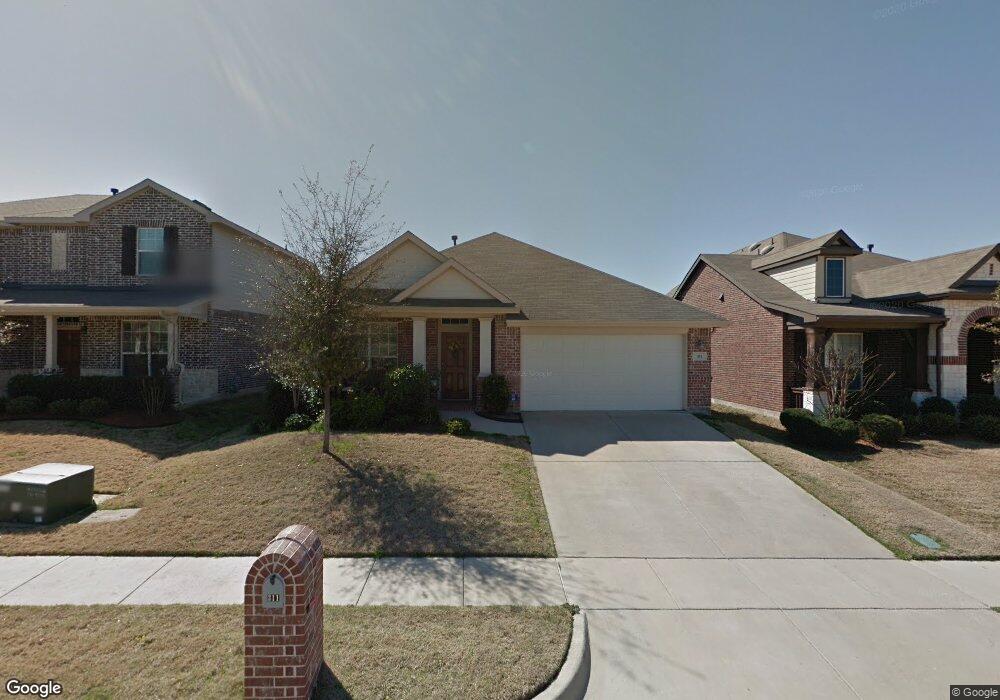
This home is located at 311 Highland Park Ln, Wylie, TX 75098 and is currently estimated at $411,915, approximately $195 per square foot. 311 Highland Park Ln is a home located in Collin County with nearby schools including Cheri Cox Elementary School, AB Harrison Intermediate School, and Grady Burnett J High School.
Ownership History
Date
Name
Owned For
Owner Type
Purchase Details
Closed on
Aug 15, 2013
Sold by
Keenan Pamela
Bought by
Keenan Dennis B and Keenan Pamela J
Current Estimated Value
Home Financials for this Owner
Home Financials are based on the most recent Mortgage that was taken out on this home.
Original Mortgage
$144,500
Outstanding Balance
$36,044
Interest Rate
4.42%
Estimated Equity
$375,871
Purchase Details
Closed on
Aug 11, 2010
Sold by
Moore Pamela
Bought by
Keenan Pamela
Purchase Details
Closed on
Nov 13, 2008
Sold by
Weekley Homes Lp
Bought by
Moore Pamela
Home Financials for this Owner
Home Financials are based on the most recent Mortgage that was taken out on this home.
Original Mortgage
$149,100
Interest Rate
6.18%
Purchase Details
Closed on
Aug 20, 2008
Sold by
Woodbridge Xii Ltd
Bought by
Weekley Homes Lp
Create a Home Valuation Report for This Property
The Home Valuation Report is an in-depth analysis detailing your home's value as well as a comparison with similar homes in the area
Home Values in the Area
Average Home Value in this Area
Purchase History
| Date | Buyer | Sale Price | Title Company |
|---|---|---|---|
| Keenan Dennis B | -- | None Available | |
| Keenan Pamela | -- | None Available | |
| Moore Pamela | -- | Ptc | |
| Weekley Homes Lp | -- | Ptc |
Source: Public Records
Mortgage History
| Date | Status | Borrower | Loan Amount |
|---|---|---|---|
| Open | Keenan Dennis B | $144,500 | |
| Previous Owner | Moore Pamela | $149,100 |
Source: Public Records
Tax History Compared to Growth
Tax History
| Year | Tax Paid | Tax Assessment Tax Assessment Total Assessment is a certain percentage of the fair market value that is determined by local assessors to be the total taxable value of land and additions on the property. | Land | Improvement |
|---|---|---|---|---|
| 2025 | $3,914 | $394,589 | $110,000 | $284,589 |
| 2024 | $3,914 | $371,952 | $110,000 | $306,024 |
| 2023 | $3,914 | $338,138 | $90,000 | $304,181 |
| 2022 | $5,620 | $307,398 | $90,000 | $275,942 |
| 2021 | $5,627 | $279,453 | $60,000 | $219,453 |
| 2020 | $6,535 | $263,202 | $60,000 | $203,202 |
| 2019 | $7,015 | $266,945 | $60,000 | $206,945 |
| 2018 | $6,821 | $253,263 | $60,000 | $193,263 |
| 2017 | $6,413 | $243,314 | $55,000 | $188,314 |
| 2016 | $6,015 | $223,274 | $50,000 | $173,274 |
| 2015 | $4,807 | $201,869 | $44,000 | $157,869 |
Source: Public Records
Map
Nearby Homes
- 301 Highland Park Ln
- 319 Highland View Dr
- 412 Highland Ridge Dr
- 1905 Fairway Crossing Rd
- 2014 Fairway Woods Dr
- 123 Monarch Way
- 217 Champion
- 206 Covington Dr
- 308 Parke Hollow Dr
- 528 Highland Ridge Dr
- 212 Colonial Dr
- 303 Parke Lake Dr
- 100 Lavender Ln
- 1706 Asbury Dr
- 102 Autumn Sage Dr
- 107 Lantana Ln
- 322 Hogue Ln
- 506 Hemlock Ct
- 103 Cascade Ln
- 807 Crescent Way
- 313 Highland Park Ln
- 309 Highland Park Ln
- 307 Highland Park Ln
- 315 Highland Park Ln
- 310 Fairland Dr
- 312 Fairland Dr
- 308 Fairland Dr
- 305 Highland Park Ln
- 314 Fairland Dr
- 306 Highland Park Ln
- 304 Highland Park Ln
- 308 Highland Park Ln
- 302 Highland Park Ln
- 304 Fairland Dr
- 303 Highland Park Ln
- 300 Highland Park Ln
- 310 Highland Park Ln
- 302 Fairland Dr
- 1924 Highland Haven Ln
- 307 Highland Fairway Ln