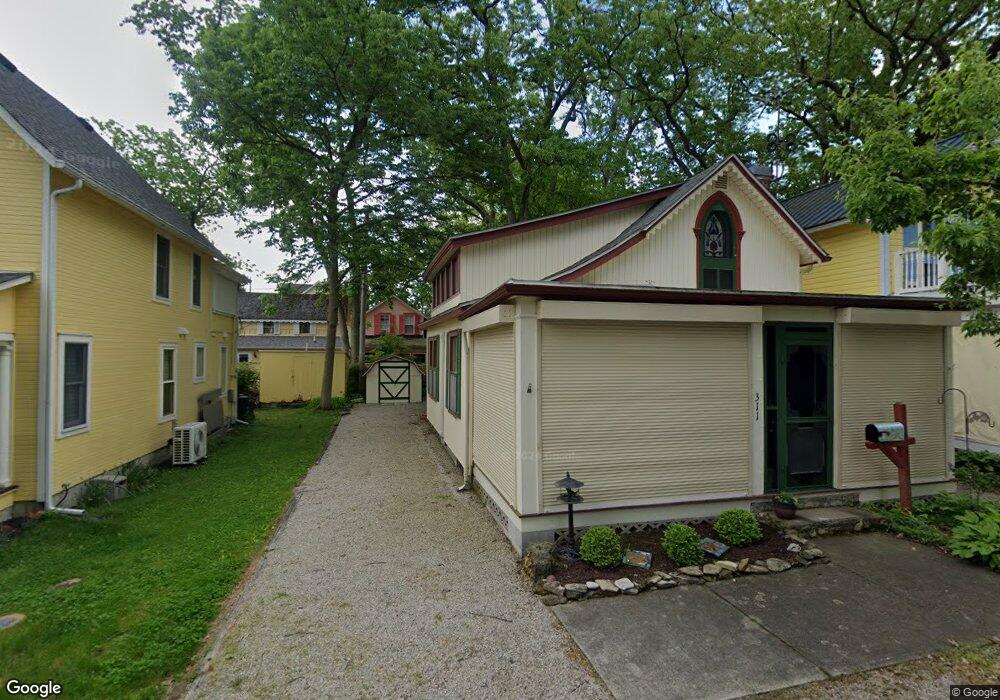
311 Lynn Ave Lakeside Marblehead, OH 43440
Estimated Value: $435,775 - $542,000
3
Beds
2
Baths
867
Sq Ft
$580/Sq Ft
Est. Value
About This Home
This home is located at 311 Lynn Ave, Lakeside Marblehead, OH 43440 and is currently estimated at $502,694, approximately $579 per square foot. 311 Lynn Ave is a home located in Ottawa County with nearby schools including Danbury Middle School and Danbury High School.
Ownership History
Date
Name
Owned For
Owner Type
Purchase Details
Closed on
Mar 29, 2017
Sold by
Knepp Ronald G and Knepp Lucinda S
Bought by
Knepp Ronald G and Knepp Lucinda S
Current Estimated Value
Purchase Details
Closed on
Dec 11, 2006
Sold by
Knepp Lucinda and Rudolph Chandra
Bought by
Knepp Et Al Ronald G
Home Financials for this Owner
Home Financials are based on the most recent Mortgage that was taken out on this home.
Original Mortgage
$85,800
Outstanding Balance
$51,490
Interest Rate
6.47%
Mortgage Type
Seller Take Back
Estimated Equity
$451,204
Purchase Details
Closed on
Nov 15, 2006
Sold by
Rudolph Chandra
Bought by
Knepp Ronald G and Knepp Lucinda S
Home Financials for this Owner
Home Financials are based on the most recent Mortgage that was taken out on this home.
Original Mortgage
$85,800
Outstanding Balance
$51,490
Interest Rate
6.47%
Mortgage Type
Seller Take Back
Estimated Equity
$451,204
Create a Home Valuation Report for This Property
The Home Valuation Report is an in-depth analysis detailing your home's value as well as a comparison with similar homes in the area
Home Values in the Area
Average Home Value in this Area
Purchase History
| Date | Buyer | Sale Price | Title Company |
|---|---|---|---|
| Knepp Ronald G | -- | Attorney | |
| Knepp Et Al Ronald G | $86,000 | -- | |
| Knepp Ronald G | $86,000 | Attorney |
Source: Public Records
Mortgage History
| Date | Status | Borrower | Loan Amount |
|---|---|---|---|
| Open | Knepp Ronald G | $85,800 |
Source: Public Records
Tax History
| Year | Tax Paid | Tax Assessment Tax Assessment Total Assessment is a certain percentage of the fair market value that is determined by local assessors to be the total taxable value of land and additions on the property. | Land | Improvement |
|---|---|---|---|---|
| 2024 | $4,607 | $134,638 | $91,280 | $43,358 |
| 2023 | $4,589 | $103,905 | $82,982 | $20,923 |
| 2022 | $3,587 | $103,905 | $82,982 | $20,923 |
| 2021 | $3,598 | $103,900 | $82,980 | $20,920 |
| 2020 | $3,035 | $82,960 | $63,830 | $19,130 |
| 2019 | $2,809 | $82,960 | $63,830 | $19,130 |
| 2018 | $2,784 | $82,330 | $63,830 | $18,500 |
| 2017 | $2,554 | $74,780 | $59,360 | $15,420 |
| 2016 | $2,529 | $74,780 | $59,360 | $15,420 |
| 2015 | $2,538 | $74,780 | $59,360 | $15,420 |
| 2014 | $1,277 | $79,250 | $63,830 | $15,420 |
| 2013 | $1,277 | $79,250 | $63,830 | $15,420 |
Source: Public Records
Map
Nearby Homes
- 317 Oak Ave
- 317 Maple Ave Unit 17
- 224 Oak Ave
- 446 Lynn Ave
- 723 Oak Ave
- 727 Oak Ave
- 132 E 4th St
- 336 Peach Ave
- 212 E 7th St
- 324 Plum Ave
- 721 Laurel Ave
- 280 N Lighthouse Oval
- 1209 Prairie St
- 329 Lighthouse Oval
- 281 N Lighthouse Oval
- 275 N Lighthouse Oval
- 502 Stone St
- 5486 E Harbor Rd
- 385 Hidden Beach Rd
- 347 Hidden Beach Rd
Your Personal Tour Guide
Ask me questions while you tour the home.