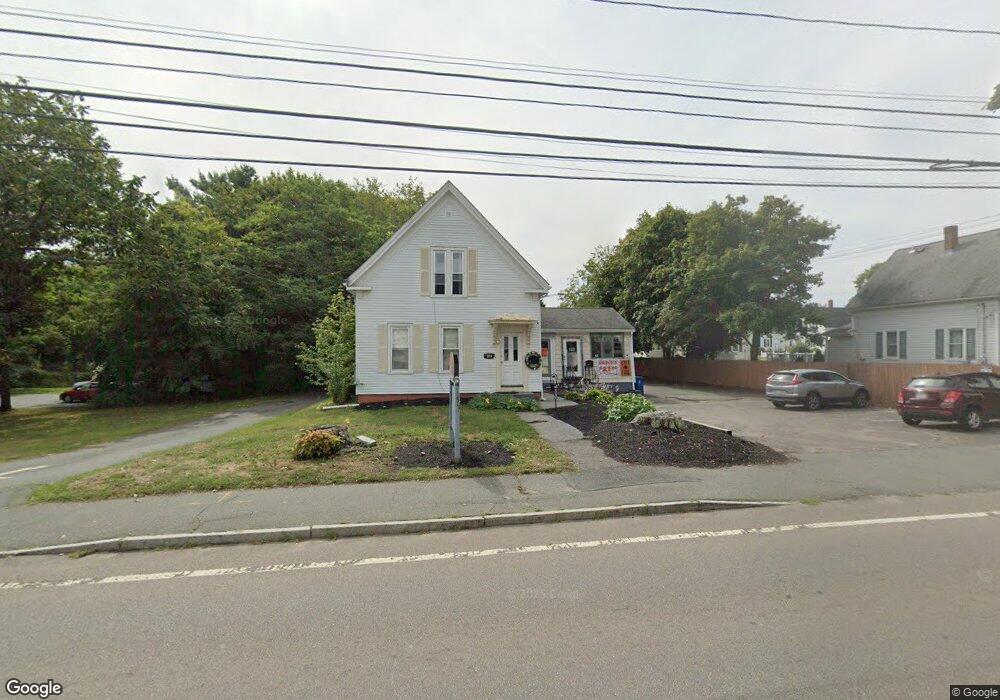
311 Market St Rockland, MA 02370
2
Beds
2
Baths
1,983
Sq Ft
0.26
Acres
About This Home
This home is located at 311 Market St, Rockland, MA 02370. 311 Market St is a home located in Plymouth County with nearby schools including Rockland Senior High School, Calvary Chapel Academy, and Holy Family Elementary School.
Ownership History
Date
Name
Owned For
Owner Type
Purchase Details
Closed on
Dec 31, 2018
Sold by
Royal Christine G and Malloy Shelly R
Bought by
Malloy Shelly R
Purchase Details
Closed on
Nov 5, 2004
Sold by
Royal Edward C
Bought by
Royal Christine G and Malloy Shelly R
Purchase Details
Closed on
May 31, 1988
Sold by
Royal Robert
Bought by
Ford Motor Credit Co
Create a Home Valuation Report for This Property
The Home Valuation Report is an in-depth analysis detailing your home's value as well as a comparison with similar homes in the area
Home Values in the Area
Average Home Value in this Area
Purchase History
| Date | Buyer | Sale Price | Title Company |
|---|---|---|---|
| Malloy Shelly R | -- | -- | |
| Royal Christine G | -- | -- | |
| Ford Motor Credit Co | $104,400 | -- |
Source: Public Records
Mortgage History
| Date | Status | Borrower | Loan Amount |
|---|---|---|---|
| Previous Owner | Ford Motor Credit Co | $167,000 | |
| Previous Owner | Ford Motor Credit Co | $25,000 | |
| Previous Owner | Ford Motor Credit Co | $109,000 | |
| Previous Owner | Ford Motor Credit Co | $108,000 |
Source: Public Records
Tax History Compared to Growth
Tax History
| Year | Tax Paid | Tax Assessment Tax Assessment Total Assessment is a certain percentage of the fair market value that is determined by local assessors to be the total taxable value of land and additions on the property. | Land | Improvement |
|---|---|---|---|---|
| 2025 | $6,976 | $510,300 | $215,200 | $295,100 |
| 2024 | $6,828 | $485,600 | $203,000 | $282,600 |
| 2023 | $6,634 | $435,900 | $176,400 | $259,500 |
| 2022 | $6,410 | $382,700 | $153,400 | $229,300 |
| 2021 | $6,026 | $348,700 | $139,400 | $209,300 |
| 2020 | $5,815 | $332,300 | $132,800 | $199,500 |
| 2019 | $5,724 | $319,400 | $126,500 | $192,900 |
| 2018 | $5,406 | $296,700 | $126,500 | $170,200 |
| 2017 | $5,204 | $281,600 | $126,500 | $155,100 |
| 2016 | $5,009 | $270,900 | $121,600 | $149,300 |
| 2015 | $4,784 | $251,400 | $113,700 | $137,700 |
| 2014 | $4,523 | $246,600 | $111,500 | $135,100 |
Source: Public Records
Map
Nearby Homes
- 133 Crescent St
- 94-96 Crescent St
- 440 Market St
- 149 Concord St
- 92 Liberty St
- 49 Liberty St
- 38 Levin Rd
- 140 W Water St
- 50 Linden Park
- 133 Spring St
- 45-47 Park St
- 225 W Water St
- 20 Pat Rose Way
- 19 Pat Rose Way
- 103 Grove St Unit 337
- 6 Pat Rose Way
- 63 Webster St
- 8 Pat Rose Way
- 119 Grove St Unit 238
- 119 Grove St Unit 223
- 303 Market St
- 16 Albion St
- 323 Market St Unit 325
- 24 Albion St
- 304 Market St
- 291 Market St
- 30 Albion St
- 323-325 Market St
- 15 Albion St
- 283 Market St Unit 2
- 283 Market St
- 283 Market St Unit 3
- 283 Market St Unit 1
- 23 Albion St
- 36 Albion St
- 292 Market St
- 282 Market St
- 275 Market St Unit 2
- 275 Market St
- 275 Market St Unit B