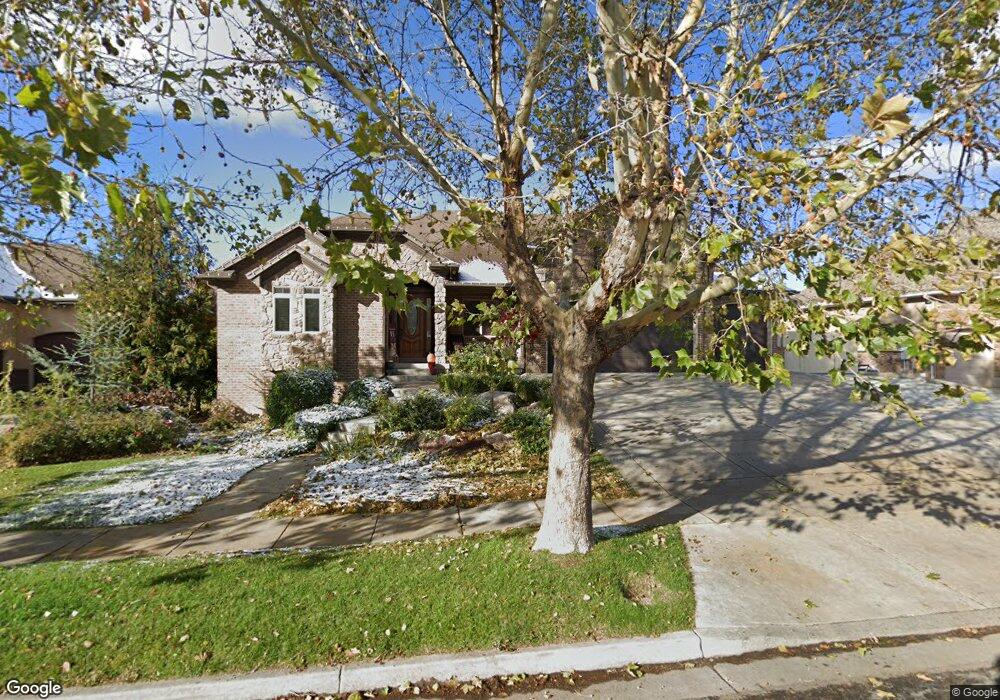
311 N 2975 W Layton, UT 84041
Estimated Value: $1,043,720 - $1,073,000
7
Beds
5
Baths
6,619
Sq Ft
$160/Sq Ft
Est. Value
About This Home
This home is located at 311 N 2975 W, Layton, UT 84041 and is currently estimated at $1,060,430, approximately $160 per square foot. 311 N 2975 W is a home located in Davis County with nearby schools including Sand Springs Elementary School, Legacy Junior High School, and Layton High School.
Ownership History
Date
Name
Owned For
Owner Type
Purchase Details
Closed on
Jan 21, 2021
Sold by
Hansen Tad K
Bought by
Wallace Alicia M and Wallace Keith A
Current Estimated Value
Home Financials for this Owner
Home Financials are based on the most recent Mortgage that was taken out on this home.
Original Mortgage
$880,600
Outstanding Balance
$784,411
Interest Rate
2.6%
Mortgage Type
VA
Estimated Equity
$276,019
Purchase Details
Closed on
Mar 10, 2005
Sold by
Big Boy Investments Inc
Bought by
Hansen Tad K
Home Financials for this Owner
Home Financials are based on the most recent Mortgage that was taken out on this home.
Original Mortgage
$328,800
Interest Rate
5.65%
Mortgage Type
Construction
Purchase Details
Closed on
Feb 28, 2005
Sold by
Mountain Green Development Llc
Bought by
Big Boy Investment Inc
Home Financials for this Owner
Home Financials are based on the most recent Mortgage that was taken out on this home.
Original Mortgage
$328,800
Interest Rate
5.65%
Mortgage Type
Construction
Create a Home Valuation Report for This Property
The Home Valuation Report is an in-depth analysis detailing your home's value as well as a comparison with similar homes in the area
Home Values in the Area
Average Home Value in this Area
Purchase History
| Date | Buyer | Sale Price | Title Company |
|---|---|---|---|
| Wallace Alicia M | -- | Investors Title Ins | |
| Hansen Tad K | -- | Lincoln Title Ins Urance Age | |
| Big Boy Investment Inc | -- | Boneville Title Co |
Source: Public Records
Mortgage History
| Date | Status | Borrower | Loan Amount |
|---|---|---|---|
| Open | Wallace Alicia M | $880,600 | |
| Previous Owner | Hansen Tad K | $328,800 | |
| Previous Owner | Big Boy Investment Inc | $328,800 |
Source: Public Records
Tax History
| Year | Tax Paid | Tax Assessment Tax Assessment Total Assessment is a certain percentage of the fair market value that is determined by local assessors to be the total taxable value of land and additions on the property. | Land | Improvement |
|---|---|---|---|---|
| 2025 | $1,731 | $598,950 | $139,110 | $459,840 |
| 2024 | $1,631 | $576,950 | $147,478 | $429,472 |
| 2023 | $1,135 | $909,000 | $159,033 | $749,967 |
| 2022 | $3,195 | $550,550 | $90,647 | $459,903 |
| 2021 | $2,206 | $734,000 | $135,934 | $598,066 |
| 2020 | $3,922 | $568,000 | $116,676 | $451,324 |
| 2019 | $3,955 | $561,000 | $114,039 | $446,961 |
| 2018 | $3,659 | $521,000 | $100,638 | $420,362 |
| 2016 | $3,471 | $254,925 | $42,472 | $212,453 |
| 2015 | $3,427 | $238,975 | $42,472 | $196,503 |
| 2014 | $2,915 | $207,845 | $42,472 | $165,373 |
| 2013 | -- | $202,829 | $41,718 | $161,111 |
Source: Public Records
Map
Nearby Homes
- 273 N 2975 W
- 84 N 3225 W
- 2794 W Gentile St
- 818 N 2625 W
- 245 S Summer Breeze Ln
- 34 S 3600 W
- 3535 W Overlook Dr
- 263 S Sunburst Dr
- 306 S Sunburst Dr
- 2480 S Main St
- 2397 W Harmony Dr
- 1250 N 2925 W
- 841 N 2175 W
- 2500 N North Fort Ln Unit 188
- 2350 N 720 W
- 867 N 2125 W
- 195 E 2325 S
- 1141 N 2275 W
- 1974 W 775 N
- 779 N 1925 W
Your Personal Tour Guide
Ask me questions while you tour the home.