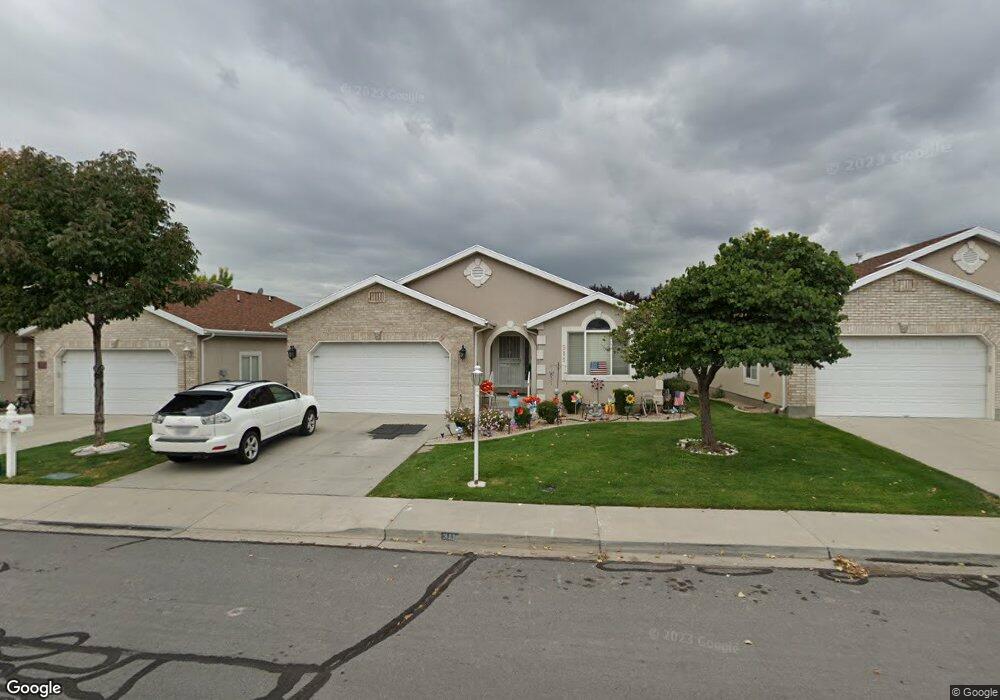
311 N 600 E Orem, UT 84097
Cascade NeighborhoodEstimated Value: $514,000 - $555,000
3
Beds
3
Baths
1,405
Sq Ft
$379/Sq Ft
Est. Value
About This Home
This home is located at 311 N 600 E, Orem, UT 84097 and is currently estimated at $532,148, approximately $378 per square foot. 311 N 600 E is a home located in Utah County with nearby schools including Cascade Elementary School, Canyon View Junior High School, and Orem High School.
Ownership History
Date
Name
Owned For
Owner Type
Purchase Details
Closed on
Apr 25, 2024
Sold by
Marsh Myrna
Bought by
Myma Marsh Family Trust and Marsh
Current Estimated Value
Purchase Details
Closed on
May 20, 1999
Sold by
Smart James L and Smart Irene B
Bought by
Marsh Myrna and Marsh Jack L
Home Financials for this Owner
Home Financials are based on the most recent Mortgage that was taken out on this home.
Original Mortgage
$105,000
Interest Rate
6.92%
Create a Home Valuation Report for This Property
The Home Valuation Report is an in-depth analysis detailing your home's value as well as a comparison with similar homes in the area
Home Values in the Area
Average Home Value in this Area
Purchase History
| Date | Buyer | Sale Price | Title Company |
|---|---|---|---|
| Myma Marsh Family Trust | -- | None Listed On Document | |
| Marsh Myrna | -- | Provo Land Title Company |
Source: Public Records
Mortgage History
| Date | Status | Borrower | Loan Amount |
|---|---|---|---|
| Previous Owner | Marsh Myrna | $105,000 |
Source: Public Records
Tax History
| Year | Tax Paid | Tax Assessment Tax Assessment Total Assessment is a certain percentage of the fair market value that is determined by local assessors to be the total taxable value of land and additions on the property. | Land | Improvement |
|---|---|---|---|---|
| 2025 | $184 | $267,575 | -- | -- |
| 2024 | $184 | $250,140 | $0 | $0 |
| 2023 | $1,916 | $251,790 | $0 | $0 |
| 2022 | $378 | $251,460 | $0 | $0 |
| 2021 | $1,864 | $360,200 | $112,500 | $247,700 |
| 2020 | $176 | $332,800 | $90,000 | $242,800 |
| 2019 | $1,538 | $303,100 | $90,000 | $213,100 |
| 2018 | $1,541 | $290,200 | $85,000 | $205,200 |
| 2017 | $1,496 | $150,920 | $0 | $0 |
| 2016 | $1,459 | $135,685 | $0 | $0 |
| 2015 | $1,531 | $134,695 | $0 | $0 |
| 2014 | $1,470 | $128,700 | $0 | $0 |
Source: Public Records
Map
Nearby Homes
Your Personal Tour Guide
Ask me questions while you tour the home.