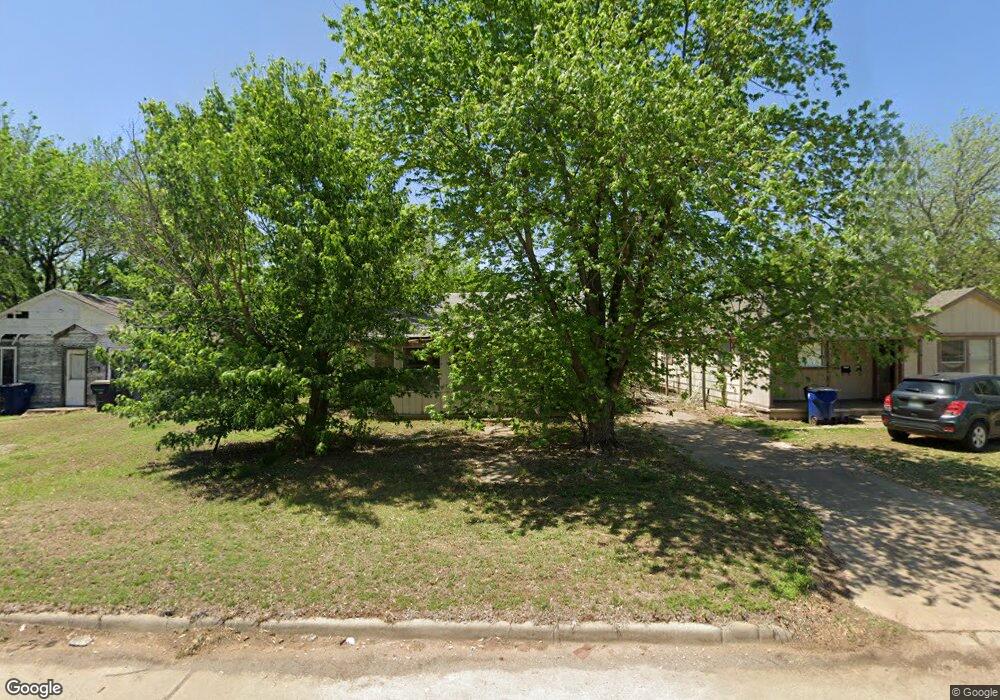
311 N A St Duncan, OK 73533
Estimated Value: $43,000 - $97,000
2
Beds
1
Bath
906
Sq Ft
$68/Sq Ft
Est. Value
About This Home
This home is located at 311 N A St, Duncan, OK 73533 and is currently estimated at $62,014, approximately $68 per square foot. 311 N A St is a home located in Stephens County with nearby schools including Woodrow Wilson Elementary School, Duncan Middle School, and Duncan High School.
Ownership History
Date
Name
Owned For
Owner Type
Purchase Details
Closed on
May 5, 2023
Sold by
Helloms Steven
Bought by
Jaa Holdings Llc
Current Estimated Value
Purchase Details
Closed on
Jun 2, 2015
Sold by
Jpmorgan Chase Bank Na
Bought by
Helloms Steven W
Purchase Details
Closed on
Feb 18, 1993
Sold by
Mccullough Gale
Bought by
Fletcher Leon and Fletcher Sylvia J
Purchase Details
Closed on
Jan 24, 1992
Sold by
Farr Candus
Purchase Details
Closed on
Jun 15, 1990
Create a Home Valuation Report for This Property
The Home Valuation Report is an in-depth analysis detailing your home's value as well as a comparison with similar homes in the area
Home Values in the Area
Average Home Value in this Area
Purchase History
| Date | Buyer | Sale Price | Title Company |
|---|---|---|---|
| Jaa Holdings Llc | $17,000 | Stewart Title | |
| Helloms Steven W | $7,000 | None Available | |
| Fletcher Leon | $8,500 | -- | |
| -- | $2,000 | -- | |
| -- | $3,500 | -- |
Source: Public Records
Tax History Compared to Growth
Tax History
| Year | Tax Paid | Tax Assessment Tax Assessment Total Assessment is a certain percentage of the fair market value that is determined by local assessors to be the total taxable value of land and additions on the property. | Land | Improvement |
|---|---|---|---|---|
| 2025 | $186 | $2,204 | $297 | $1,907 |
| 2024 | $179 | $2,099 | $297 | $1,802 |
| 2023 | $179 | $2,378 | $297 | $2,081 |
| 2022 | $88 | $1,091 | $297 | $794 |
| 2021 | $88 | $1,039 | $297 | $742 |
| 2020 | $81 | $943 | $297 | $646 |
| 2019 | $78 | $898 | $297 | $601 |
| 2018 | $76 | $898 | $297 | $601 |
| 2017 | $70 | $855 | $297 | $558 |
| 2016 | $66 | $776 | $297 | $479 |
| 2015 | $159 | $2,306 | $297 | $2,009 |
| 2014 | $159 | $2,762 | $440 | $2,322 |
Source: Public Records
Map
Nearby Homes