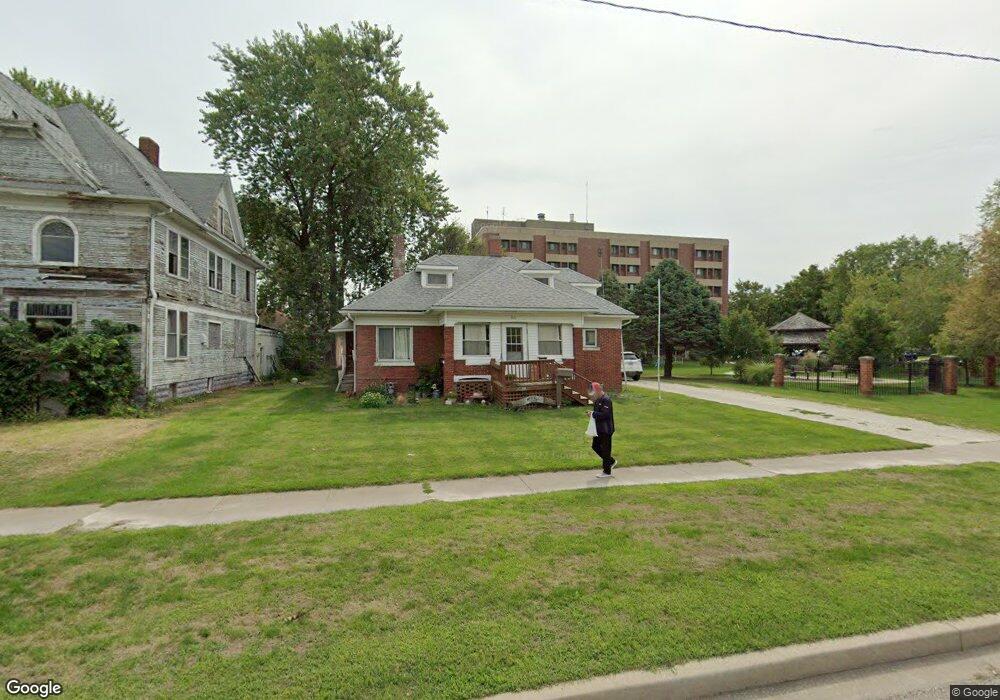
311 N Main St Abingdon, IL 61410
Estimated Value: $44,000 - $75,000
Studio
--
Bath
826
Sq Ft
$75/Sq Ft
Est. Value
About This Home
This home is located at 311 N Main St, Abingdon, IL 61410 and is currently estimated at $61,972, approximately $75 per square foot. 311 N Main St is a home located in Knox County with nearby schools including Hedding Grade School, Avon Elementary School, and Abingdon-Avon Middle School.
Ownership History
Date
Name
Owned For
Owner Type
Purchase Details
Closed on
Mar 24, 2023
Sold by
Sharp Eldon R and Sharp Rebecca V
Bought by
Johnson Michelle L
Current Estimated Value
Home Financials for this Owner
Home Financials are based on the most recent Mortgage that was taken out on this home.
Original Mortgage
$40,000
Outstanding Balance
$27,533
Interest Rate
5.8%
Mortgage Type
Construction
Estimated Equity
$34,439
Create a Home Valuation Report for This Property
The Home Valuation Report is an in-depth analysis detailing your home's value as well as a comparison with similar homes in the area
Home Values in the Area
Average Home Value in this Area
Purchase History
| Date | Buyer | Sale Price | Title Company |
|---|---|---|---|
| Johnson Michelle L | $45,333 | -- |
Source: Public Records
Mortgage History
| Date | Status | Borrower | Loan Amount |
|---|---|---|---|
| Open | Johnson Michelle L | $40,000 |
Source: Public Records
Tax History
| Year | Tax Paid | Tax Assessment Tax Assessment Total Assessment is a certain percentage of the fair market value that is determined by local assessors to be the total taxable value of land and additions on the property. | Land | Improvement |
|---|---|---|---|---|
| 2024 | $1,304 | $22,000 | $2,630 | $19,370 |
| 2023 | $1,304 | $19,850 | $2,370 | $17,480 |
| 2022 | $1,447 | $16,460 | $2,250 | $14,210 |
| 2021 | $1,420 | $15,820 | $2,160 | $13,660 |
| 2020 | $1,372 | $15,210 | $2,080 | $13,130 |
| 2019 | $1,410 | $15,060 | $2,060 | $13,000 |
| 2018 | $1,372 | $14,620 | $2,000 | $12,620 |
| 2017 | $1,359 | $14,330 | $1,960 | $12,370 |
| 2015 | -- | $14,050 | $1,920 | $12,130 |
| 2013 | $1,333 | $13,910 | $1,900 | $12,010 |
Source: Public Records
Map
Nearby Homes
- 106 E Jackson St
- 110 W Jackson St
- 500 N Monroe St
- 207 E Meek St
- 103 N Swarts St
- 407 W Martin St
- 614 S East St
- 905 W Palmer St
- 1196 160th St
- 1015 Sunny Knoll Dr
- 409 Knox Highway 26
- 999 Breezy Bluff Dr
- Lot 11 Spoden Ln
- Lot 2 Spoden Ln
- Lot 3 Spoden Ln
- Lot 1 Spoden Ln
- Lot 6 Spoden Ln
- Lot 12 Spoden Ln
- 1077 Knox Road 500 E
- Lot 2 & 3 Fleisher Rd
- 313 N Main St
- 103 E Latimer St
- 105 E Latimer St
- 209 N Main St
- 400 N Jefferson St
- 306 N Main St
- 308 N Main St
- 109 E Pearl St
- 402 N Jefferson St
- 400 N Main St
- 205 N Main St
- 206 N Jefferson St
- 303 N Jefferson St
- 301 N Jefferson St
- 404 N Jefferson St
- 407 N Rotary Dr
- 407 N Rotary Dr Unit Rotary
- 305 N Jefferson St
- 103 W Latimer St
- 210 N Main St
Your Personal Tour Guide
Ask me questions while you tour the home.