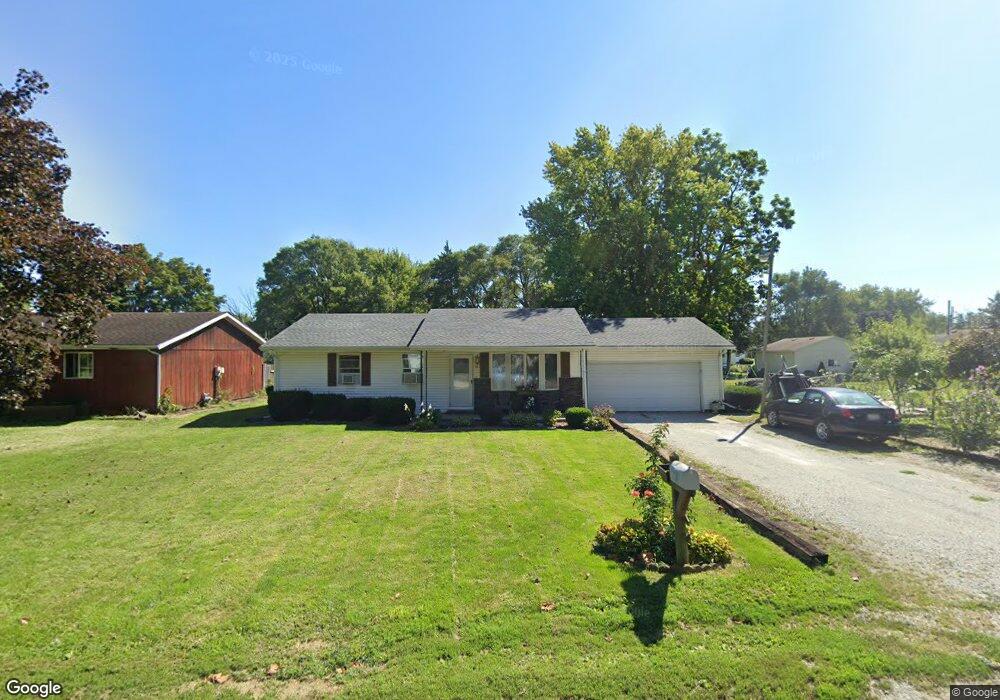
311 N Secor St Gilman, IL 60938
Estimated Value: $118,000 - $149,000
2
Beds
1
Bath
1,020
Sq Ft
$126/Sq Ft
Est. Value
About This Home
This home is located at 311 N Secor St, Gilman, IL 60938 and is currently estimated at $128,656, approximately $126 per square foot. 311 N Secor St is a home located in Iroquois County with nearby schools including Iroquois West Elementary School/Danforth, Iroquois West Elementary School/Thawville, and Iroquois West Middle School.
Ownership History
Date
Name
Owned For
Owner Type
Purchase Details
Closed on
Apr 5, 2023
Sold by
Williams Mark A
Bought by
Williams Kimberly
Current Estimated Value
Purchase Details
Closed on
May 31, 2017
Sold by
Hanson Susan L and Harweger Tamara D
Bought by
Ortiz Jorge Reyes and Ayala Maria P Lopez
Home Financials for this Owner
Home Financials are based on the most recent Mortgage that was taken out on this home.
Original Mortgage
$58,000
Interest Rate
4.05%
Mortgage Type
Future Advance Clause Open End Mortgage
Create a Home Valuation Report for This Property
The Home Valuation Report is an in-depth analysis detailing your home's value as well as a comparison with similar homes in the area
Home Values in the Area
Average Home Value in this Area
Purchase History
| Date | Buyer | Sale Price | Title Company |
|---|---|---|---|
| Williams Kimberly | -- | None Listed On Document | |
| Ortiz Jorge Reyes | $67,000 | Attorney |
Source: Public Records
Mortgage History
| Date | Status | Borrower | Loan Amount |
|---|---|---|---|
| Previous Owner | Ortiz Jorge Reyes | $58,000 |
Source: Public Records
Tax History Compared to Growth
Tax History
| Year | Tax Paid | Tax Assessment Tax Assessment Total Assessment is a certain percentage of the fair market value that is determined by local assessors to be the total taxable value of land and additions on the property. | Land | Improvement |
|---|---|---|---|---|
| 2024 | $2,386 | $36,510 | $4,940 | $31,570 |
| 2023 | $2,386 | $34,520 | $4,670 | $29,850 |
| 2022 | $2,199 | $34,170 | $4,620 | $29,550 |
| 2021 | $1,976 | $29,210 | $3,950 | $25,260 |
| 2020 | $1,957 | $27,210 | $3,680 | $23,530 |
| 2019 | $1,902 | $26,320 | $3,560 | $22,760 |
| 2018 | $1,842 | $25,640 | $3,470 | $22,170 |
| 2017 | $788 | $25,190 | $3,410 | $21,780 |
| 2016 | $209 | $25,190 | $3,410 | $21,780 |
| 2015 | $203 | $24,880 | $3,370 | $21,510 |
| 2014 | $203 | $24,430 | $3,310 | $21,120 |
| 2013 | $290 | $25,510 | $3,460 | $22,050 |
Source: Public Records
Map
Nearby Homes
- 322 N Peoria St
- 213 N Peoria St
- 507 N Secor St
- 113 N Central St
- 116 N Main St
- Sec7 Twp26n R10e Rd
- 224 N Maple St
- 112 N Maple St
- 617 N Hartwell St
- 614 S Thomas St
- 618 S Thomas St
- 1702 N 600 Rd E
- 1730 N 600 Rd E
- 929 U S 24
- 3 Carlock Dr
- 308 Jefferson St
- 400 W Adams St
- 202 N 5th St
- 400 E 2423 County Rd
- 205 S Poplar St