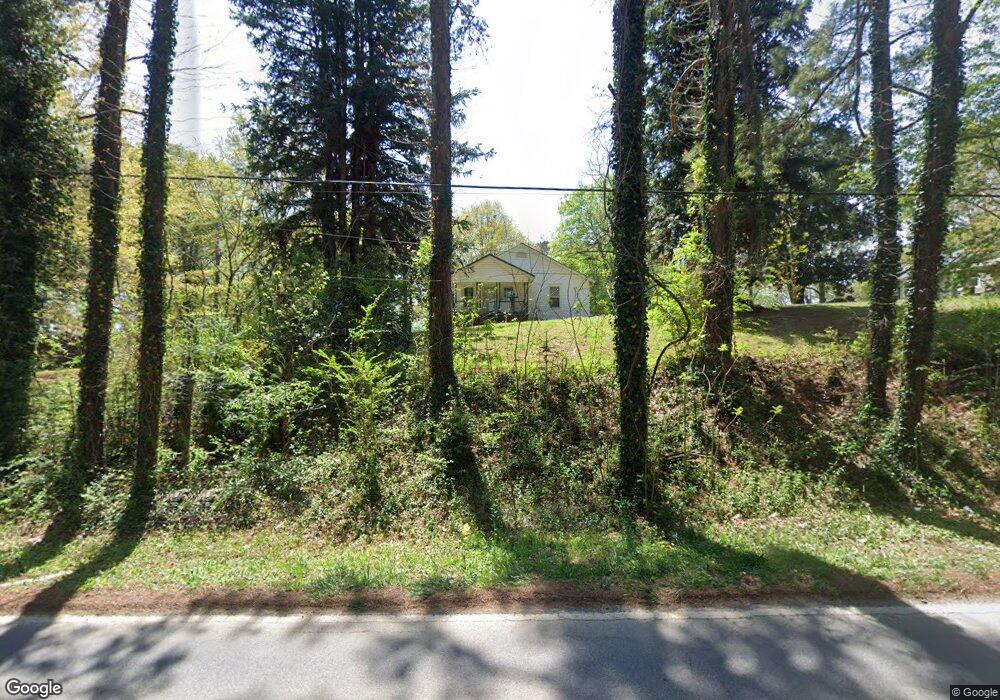
311 New Prospect Rd Aragon, GA 30104
Estimated Value: $90,000 - $144,226
2
Beds
1
Bath
1,021
Sq Ft
$122/Sq Ft
Est. Value
About This Home
This home is located at 311 New Prospect Rd, Aragon, GA 30104 and is currently estimated at $125,057, approximately $122 per square foot. 311 New Prospect Rd is a home located in Polk County with nearby schools including Rockmart Middle School.
Ownership History
Date
Name
Owned For
Owner Type
Purchase Details
Closed on
Mar 9, 2012
Sold by
Hitchcock Parris A
Bought by
Newman Raymond Edward
Current Estimated Value
Purchase Details
Closed on
Sep 5, 2007
Sold by
Sec Of Housing & U
Bought by
Hitchcock Parris A
Purchase Details
Closed on
Jun 1, 2006
Sold by
Not Provided
Bought by
Hitchcock Parri
Purchase Details
Closed on
Mar 1, 2006
Sold by
Robert Lee Williams
Bought by
Mers Inc
Purchase Details
Closed on
Jan 3, 2006
Sold by
Not Provided
Bought by
Hitchcock Parri
Purchase Details
Closed on
Feb 28, 2003
Sold by
Taylor Ricky Dwayne and Andrea Joy Taylor
Bought by
Williams Robert Lee and Amanda Courtn
Purchase Details
Closed on
Oct 5, 1998
Sold by
Real Estate Investment Group
Bought by
Taylor Ricky Dewayne
Purchase Details
Closed on
Mar 20, 1989
Sold by
Kelley Annie Mae
Bought by
Taylor Ricky D
Purchase Details
Closed on
Mar 28, 1956
Bought by
Kelley Henry
Create a Home Valuation Report for This Property
The Home Valuation Report is an in-depth analysis detailing your home's value as well as a comparison with similar homes in the area
Home Values in the Area
Average Home Value in this Area
Purchase History
| Date | Buyer | Sale Price | Title Company |
|---|---|---|---|
| Newman Raymond Edward | $34,000 | -- | |
| Hitchcock Parris A | $35,000 | -- | |
| Hitchcock Parri | -- | -- | |
| Mers Inc | $62,060 | -- | |
| Hitchcock Parri | -- | -- | |
| Williams Robert Lee | $59,900 | -- | |
| Taylor Ricky Dewayne | -- | -- | |
| Taylor Ricky D | $32,000 | -- | |
| Kelley Henry | -- | -- |
Source: Public Records
Tax History Compared to Growth
Tax History
| Year | Tax Paid | Tax Assessment Tax Assessment Total Assessment is a certain percentage of the fair market value that is determined by local assessors to be the total taxable value of land and additions on the property. | Land | Improvement |
|---|---|---|---|---|
| 2024 | $793 | $37,944 | $3,299 | $34,645 |
| 2023 | $590 | $24,864 | $3,299 | $21,565 |
| 2022 | $486 | $20,477 | $2,200 | $18,277 |
| 2021 | $492 | $20,477 | $2,200 | $18,277 |
| 2020 | $493 | $20,477 | $2,200 | $18,277 |
| 2019 | $463 | $17,227 | $2,200 | $15,027 |
| 2018 | $461 | $16,740 | $2,200 | $14,540 |
| 2017 | $456 | $16,740 | $2,200 | $14,540 |
| 2016 | $472 | $17,357 | $2,817 | $14,540 |
| 2015 | $479 | $17,566 | $2,817 | $14,749 |
| 2014 | $483 | $17,566 | $2,817 | $14,749 |
Source: Public Records
Map
Nearby Homes
- 327 New Prospect Rd
- 327 Prospect Rd
- 293 New Prospect Rd
- 322 New Prospect Rd
- 341 New Prospect Rd
- 283 New Prospect Rd
- 271 New Prospect Rd
- 350 New Prospect Rd
- 274 New Prospect Rd
- 0 Prospect Rd
- 0 Prospect Rd Unit 10272348
- 0 Prospect Rd Unit 7359146
- 0 Prospect Rd Unit 7185128
- 0 Prospect Rd Unit 8467316
- 0 Prospect Rd Unit 8459347
- 0 Prospect Rd Unit 8158911
- 0 Prospect Rd Unit 8028007
- 0 Prospect Rd Unit 3260717
- 0 Prospect Rd Unit 7410018
- 0 Prospect Rd Unit 8366035