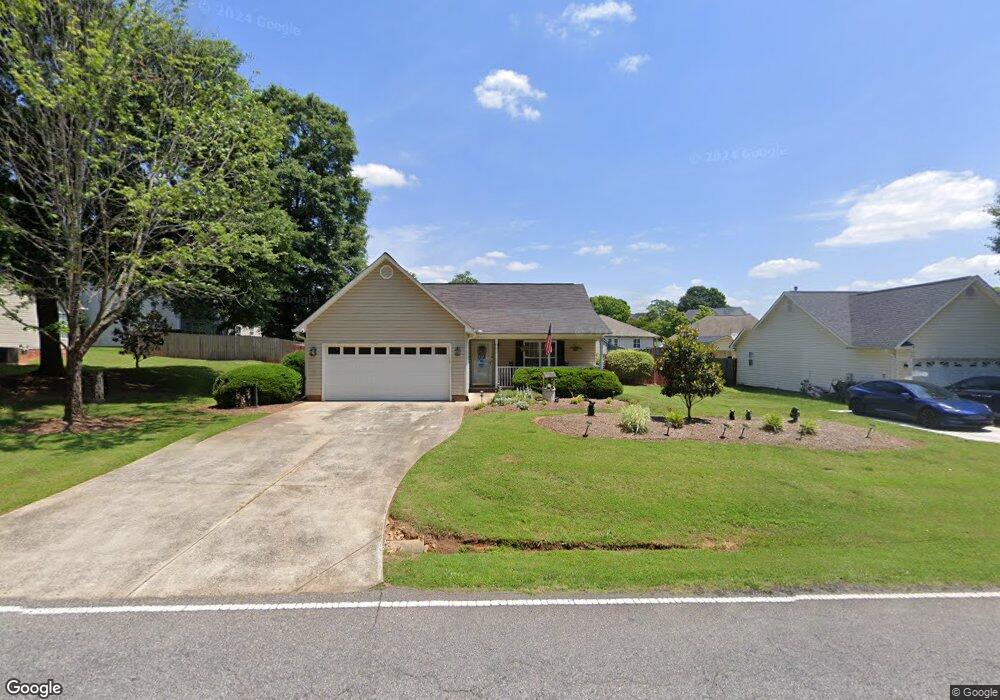
311 Old John Dodd Rd Boiling Springs, SC 29316
Estimated Value: $206,000 - $237,114
3
Beds
2
Baths
1,280
Sq Ft
$177/Sq Ft
Est. Value
About This Home
This home is located at 311 Old John Dodd Rd, Boiling Springs, SC 29316 and is currently estimated at $226,279, approximately $176 per square foot. 311 Old John Dodd Rd is a home located in Spartanburg County with nearby schools including Boiling Springs Middle School, Boiling Springs High School, and High Point Academy.
Ownership History
Date
Name
Owned For
Owner Type
Purchase Details
Closed on
Nov 2, 2017
Sold by
Carpenter Sidonie Rae
Bought by
Carpenter Sidonie Rae and Chenier Patrick Holland
Current Estimated Value
Purchase Details
Closed on
Jun 30, 2015
Sold by
Fullenwider Ronisha L
Bought by
Carpenter Sidonie Rae
Home Financials for this Owner
Home Financials are based on the most recent Mortgage that was taken out on this home.
Original Mortgage
$118,872
Interest Rate
3.92%
Mortgage Type
New Conventional
Purchase Details
Closed on
Jul 16, 2007
Sold by
Varner Tonya
Bought by
Fullenwider Ronisha L M
Home Financials for this Owner
Home Financials are based on the most recent Mortgage that was taken out on this home.
Original Mortgage
$131,500
Interest Rate
6.71%
Mortgage Type
Purchase Money Mortgage
Purchase Details
Closed on
Aug 17, 2004
Sold by
Young Tiffani S and Taylor Gardner D
Bought by
Varner Tonya
Create a Home Valuation Report for This Property
The Home Valuation Report is an in-depth analysis detailing your home's value as well as a comparison with similar homes in the area
Home Values in the Area
Average Home Value in this Area
Purchase History
| Date | Buyer | Sale Price | Title Company |
|---|---|---|---|
| Carpenter Sidonie Rae | -- | None Available | |
| Carpenter Sidonie Rae | $118,872 | None Available | |
| Fullenwider Ronisha L M | $131,500 | Jasmine Title Agency Llc | |
| Varner Tonya | $114,000 | -- |
Source: Public Records
Mortgage History
| Date | Status | Borrower | Loan Amount |
|---|---|---|---|
| Previous Owner | Carpenter Sidonie Rae | $118,872 | |
| Previous Owner | Fullenwider Ronisha L M | $131,500 |
Source: Public Records
Tax History Compared to Growth
Tax History
| Year | Tax Paid | Tax Assessment Tax Assessment Total Assessment is a certain percentage of the fair market value that is determined by local assessors to be the total taxable value of land and additions on the property. | Land | Improvement |
|---|---|---|---|---|
| 2025 | $809 | $6,269 | $971 | $5,298 |
| 2024 | $809 | $6,269 | $971 | $5,298 |
| 2023 | $809 | $6,269 | $971 | $5,298 |
| 2022 | $677 | $5,451 | $707 | $4,744 |
| 2021 | $677 | $5,451 | $707 | $4,744 |
| 2020 | $663 | $5,451 | $707 | $4,744 |
| 2019 | $663 | $5,451 | $707 | $4,744 |
| 2018 | $649 | $5,451 | $707 | $4,744 |
| 2017 | $877 | $4,740 | $720 | $4,020 |
| 2016 | $877 | $4,740 | $720 | $4,020 |
| 2015 | $872 | $4,784 | $720 | $4,064 |
| 2014 | $867 | $4,784 | $720 | $4,064 |
Source: Public Records
Map
Nearby Homes
- 156 Hunter Ridge Dr
- 238 River Forest Dr
- 921 E Emerald Springs Dr
- 559 Falls Cottage Run
- 0 Woodshire Dr Unit 316794
- 108 Woodshire Dr
- 725 Cotton Branch Dr
- 2031 Evergreen Dr
- 9 Willow Pines Ct
- 522 Hemlock Dr
- 210 Oakmont Dr
- 2274 Hemming Way
- 112 Wells Dr
- 3038 Elmhurst Dr
- 100 Clary Dr
- 109 Bondale Dr
- 3134 Hillgate Trail
- 2325 Caffry Ln
- Wisteria II Plan at Lynbrook
- Bradley II Plan at Lynbrook
- 317 Old John Dodd Rd
- 238 Belcher Rd
- 303 Old John Dodd Rd
- 239 Rachel Evans Dr
- 243 Rachel Evans Dr
- 246 Belcher Rd
- 323 Old John Dodd Rd
- 235 Rachel Evans Dr
- 247 Rachel Evans Dr
- 252 Belcher Rd
- 329 Old John Dodd Rd
- 200 River Forest Dr
- 231 Rachel Evans Dr
- 241 Belcher Rd
- 262 Belcher Rd
- 240 Rachel Evans Dr
- 335 Old John Dodd Rd
- 227 Rachel Evans Dr
- 234 Rachel Evans Dr
- 251 Belcher Rd