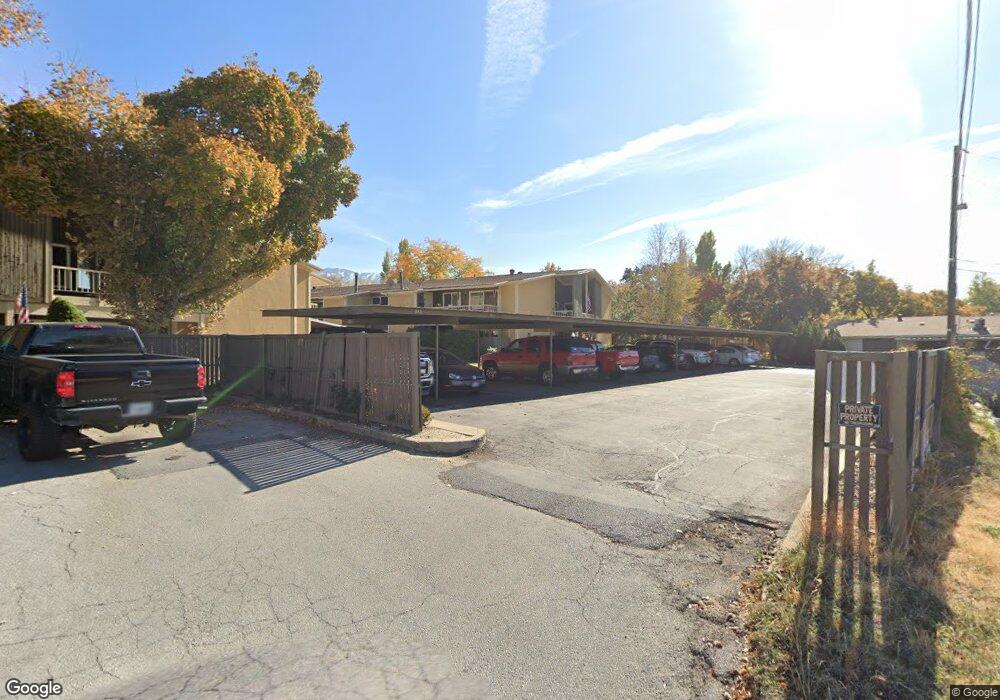
311 Peach Ln Bountiful, UT 84010
Estimated Value: $288,000 - $308,000
About This Home
This home is located at 311 Peach Ln, Bountiful, UT 84010 and is currently estimated at $300,512, approximately $286 per square foot. 311 Peach Ln is a home located in Davis County with nearby schools including Valley View School, Millcreek Junior High School, and Bountiful High School.
Ownership History
We collect this data history from publicly available records. To have your information removed, we recommend requesting removal directly through your county’s website.
Purchase Details
Purchase Details
Home Financials for this Owner
Home Financials are based on the most recent Mortgage that was taken out on this home.Purchase Details
Home Financials for this Owner
Home Financials are based on the most recent Mortgage that was taken out on this home.Purchase Details
Purchase Details
Purchase History
We collect this data history from publicly available records. To have your information removed, we recommend requesting removal directly through your county’s website.
| Date | Buyer | Sale Price | Title Company |
|---|---|---|---|
| -- | Northwest Title | ||
| -- | Western States Title Company | ||
| -- | Western States Title Company | ||
| -- | None Available | ||
| -- | -- |
Mortgage History
We collect this data history from publicly available records. To have your information removed, we recommend requesting removal directly through your county’s website.
| Date | Status | Borrower | Loan Amount |
|---|---|---|---|
| Previous Owner | $95,000 |
Tax History
We collect this data history from publicly available records. To have your information removed, we recommend requesting removal directly through your county’s website.
| Year | Tax Paid | Tax Assessment Tax Assessment Total Assessment is a certain percentage of the fair market value that is determined by local assessors to be the total taxable value of land and additions on the property. | Land | Improvement |
|---|---|---|---|---|
| 2025 | $1,755 | $164,450 | $48,950 | $115,500 |
| 2024 | $1,681 | $160,600 | $54,450 | $106,150 |
| 2023 | $1,654 | $157,850 | $51,150 | $106,700 |
| 2022 | $1,694 | $293,000 | $59,000 | $234,000 |
| 2021 | $1,555 | $226,000 | $46,000 | $180,000 |
| 2020 | $1,364 | $199,000 | $42,600 | $156,400 |
| 2019 | $1,269 | $180,000 | $39,000 | $141,000 |
| 2018 | $1,148 | $160,000 | $36,000 | $124,000 |
| 2016 | $900 | $67,375 | $12,925 | $54,450 |
| 2015 | $833 | $58,630 | $12,925 | $45,705 |
| 2014 | $805 | $58,205 | $18,333 | $39,872 |
| 2013 | -- | $68,341 | $16,775 | $51,566 |
Map
- 337 Peach Ln
- 447 E 550 S
- 456 E 500 S
- 545 S 100 E
- 146 E 100 S Unit 4
- 650 S Main St Unit 4104
- 650 S Main St Unit 3304
- 650 S Main St Unit 6206
- 650 S Main St Unit 6103
- 698 E 200 S
- 32 W 400 S
- 195 E 100 N
- 720 E Center St
- 70 N Main St Unit 213
- 185 W 850 S
- 795 Abby Ln Unit 5
- 439 E 1650 S
- 473 E 1650 S
- 1611 S 75 E
- 55 E 200 N Unit 2
- 315 E Peach Ln
- 305 Peach Ln
- 305 Peach Ln Unit G
- 301 Peach Ln
- 301 E Peach Ln
- 309 Peach Ln
- 309 E Peach Ln
- 315 Peach Ln
- 313 Peach Ln
- 303 Peach Ln
- 307 Peach Ln Unit H
- 307 Peach Ln Unit B
- 329 Peach Ln Unit C
- 325 Peach Ln
- 329 E Peach Ln S Unit C E-2
- 319 Peach Ln
- 323 Peach Ln Unit H
- 317 Peach Ln
- 345 Peach Ln
- 321 Peach Ln
Ask me questions while you tour the home.