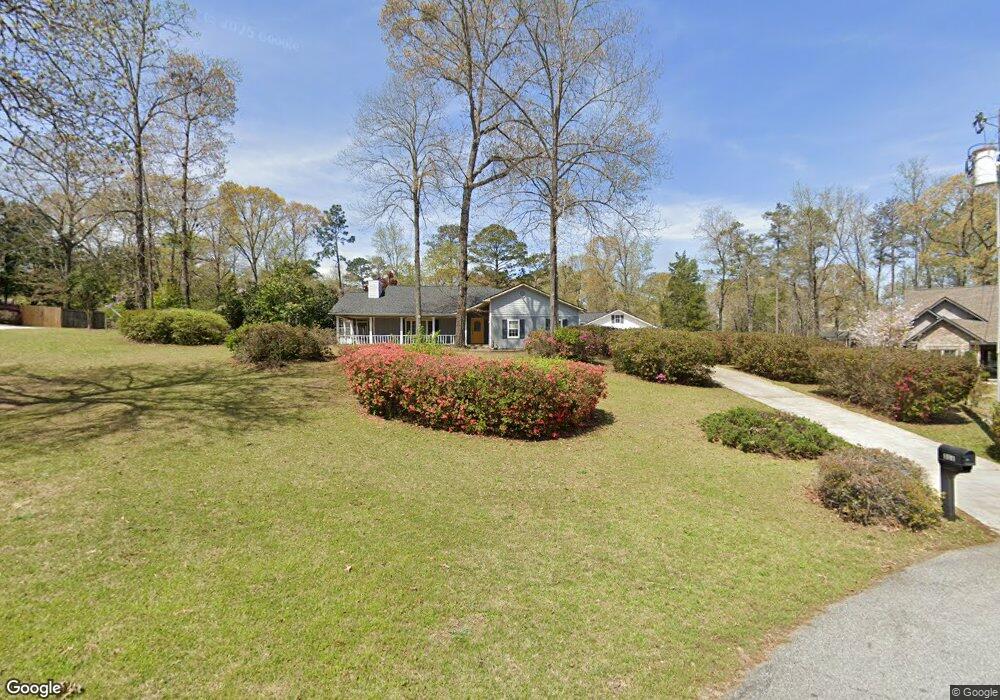
311 Quail Run Dr Warner Robins, GA 31088
Estimated Value: $327,160 - $366,000
3
Beds
4
Baths
2,428
Sq Ft
$143/Sq Ft
Est. Value
About This Home
This home is located at 311 Quail Run Dr, Warner Robins, GA 31088 and is currently estimated at $346,790, approximately $142 per square foot. 311 Quail Run Dr is a home located in Houston County with nearby schools including Quail Run Elementary School, Thomson Middle School, and Northside High School.
Ownership History
Date
Name
Owned For
Owner Type
Purchase Details
Closed on
Jun 29, 2016
Sold by
Williams Carol E
Current Estimated Value
Purchase Details
Closed on
Mar 13, 2006
Bought by
Williams Carole E
Purchase Details
Closed on
Oct 31, 2000
Sold by
Farrell Julius Carl
Bought by
Williams Carole E
Purchase Details
Closed on
May 5, 1978
Bought by
Farrell Julius Carl
Create a Home Valuation Report for This Property
The Home Valuation Report is an in-depth analysis detailing your home's value as well as a comparison with similar homes in the area
Home Values in the Area
Average Home Value in this Area
Purchase History
| Date | Buyer | Sale Price | Title Company |
|---|---|---|---|
| -- | $205,000 | -- | |
| Williams Carole E | -- | None Available | |
| Williams Carole E | $160,500 | -- | |
| Farrell Julius Carl | -- | -- |
Source: Public Records
Tax History
| Year | Tax Paid | Tax Assessment Tax Assessment Total Assessment is a certain percentage of the fair market value that is determined by local assessors to be the total taxable value of land and additions on the property. | Land | Improvement |
|---|---|---|---|---|
| 2025 | -- | $118,080 | $12,000 | $106,080 |
| 2024 | -- | $116,680 | $12,000 | $104,680 |
| 2023 | $2,322 | $96,080 | $12,000 | $84,080 |
| 2022 | $2,096 | $86,720 | $11,200 | $75,520 |
| 2021 | $1,961 | $80,720 | $11,200 | $69,520 |
| 2020 | $1,869 | $76,560 | $10,080 | $66,480 |
| 2019 | $1,869 | $76,560 | $10,080 | $66,480 |
| 2018 | $1,869 | $76,560 | $10,080 | $66,480 |
| 2017 | $1,871 | $76,560 | $10,080 | $66,480 |
| 2016 | $1,402 | $59,280 | $10,080 | $49,200 |
| 2015 | $1,402 | $59,280 | $10,080 | $49,200 |
| 2014 | -- | $59,280 | $10,080 | $49,200 |
| 2013 | -- | $59,280 | $10,080 | $49,200 |
Source: Public Records
Map
Nearby Homes
- 101 Joy Dr
- 407 Smoke Rise Dr
- 511 Pheasant Ridge Dr
- 305 Empire Trail
- 113 Joy Dr
- 312 Davids Place Dr
- 305 Clayton Scott St
- 121 Briarmoor Dr
- 113 Quail Run Dr
- 249 Hatcher Rd
- 301 Bowen Dr
- 102 Smoke Rise Dr
- 108 Turtle Dove Ct
- 713 Pheasant Ridge Dr
- 100 Briarmoor Dr
- 103 Emberly Ln
- 101 Elk Trail
- 208 Sedgebrooke Dr
- 112 Scotsburg Dr
- 234 Sedgebrooke Dr
- 313 Quail Run Dr
- 309 Quail Run Dr
- 202 Joy Dr
- 312 Quail Run Dr
- 307 Quail Run Dr
- 104 Chimney Place
- 100 Chimney Place
- 102 Chimney Place
- 304 Smoke Rise Dr
- 302 Smoke Rise Dr
- 305 Quail Run Dr
- 203 Joy Dr
- 306 Smoke Rise Dr
- 300 Smoke Rise Dr
- 306 Quail Run Dr
- 303 Quail Run Dr
- 200 Joy Dr
- 305 Smoke Rise Dr
- 305 Smoke Rise Dr Unit 20
- 303 Smoke Rise Dr
Your Personal Tour Guide
Ask me questions while you tour the home.