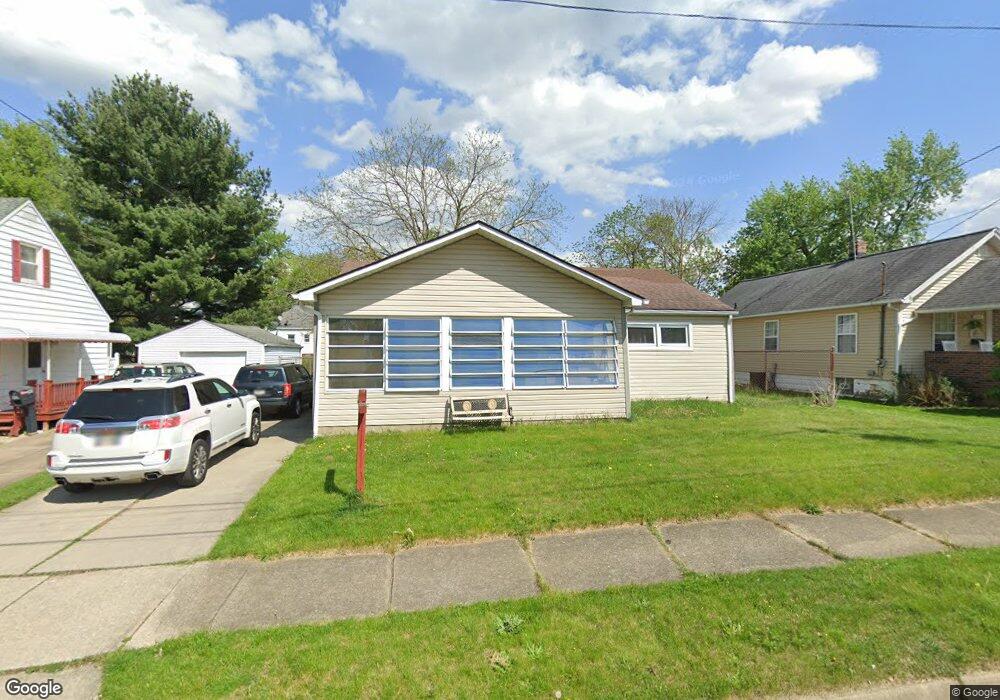
311 Ripley Ave Akron, OH 44312
Ellet NeighborhoodEstimated Value: $150,000 - $169,000
2
Beds
1
Bath
1,252
Sq Ft
$126/Sq Ft
Est. Value
About This Home
This home is located at 311 Ripley Ave, Akron, OH 44312 and is currently estimated at $157,575, approximately $125 per square foot. 311 Ripley Ave is a home located in Summit County with nearby schools including Ellet High School, Summit Academy Akron Elementary School, and Hatton Community Learning Center.
Ownership History
Date
Name
Owned For
Owner Type
Purchase Details
Closed on
Jan 20, 2016
Sold by
Wells Fargo Bank Na
Bought by
Stewart Tristan Curtis
Current Estimated Value
Purchase Details
Closed on
Dec 9, 2015
Sold by
Hoffman Gary D
Bought by
Wells Fargo Bank Na
Purchase Details
Closed on
Jan 31, 2002
Sold by
Knieriem C Marie
Bought by
Hoffman Gary D and Hoffman Maryann
Home Financials for this Owner
Home Financials are based on the most recent Mortgage that was taken out on this home.
Original Mortgage
$103,184
Interest Rate
7.23%
Mortgage Type
FHA
Purchase Details
Closed on
Sep 15, 2001
Sold by
Trozzo Sandra and Swiger Susan
Bought by
Knieriem C Marie
Purchase Details
Closed on
Sep 6, 1999
Sold by
Marie Knieriem C
Bought by
Knieriem C Marie and Trozzo Sandra
Create a Home Valuation Report for This Property
The Home Valuation Report is an in-depth analysis detailing your home's value as well as a comparison with similar homes in the area
Home Values in the Area
Average Home Value in this Area
Purchase History
| Date | Buyer | Sale Price | Title Company |
|---|---|---|---|
| Stewart Tristan Curtis | $26,221 | Omega Title Agency Llc | |
| Wells Fargo Bank Na | $50,000 | None Available | |
| Hoffman Gary D | $104,000 | Endress/Lawyers Title | |
| Knieriem C Marie | -- | -- | |
| Knieriem C Marie | -- | -- |
Source: Public Records
Mortgage History
| Date | Status | Borrower | Loan Amount |
|---|---|---|---|
| Previous Owner | Hoffman Gary D | $103,184 |
Source: Public Records
Tax History Compared to Growth
Tax History
| Year | Tax Paid | Tax Assessment Tax Assessment Total Assessment is a certain percentage of the fair market value that is determined by local assessors to be the total taxable value of land and additions on the property. | Land | Improvement |
|---|---|---|---|---|
| 2025 | $3,829 | $44,024 | $9,181 | $34,843 |
| 2024 | $2,610 | $44,024 | $9,181 | $34,843 |
| 2023 | $3,829 | $44,024 | $9,181 | $34,843 |
| 2022 | $2,420 | $31,770 | $6,605 | $25,165 |
| 2021 | $2,240 | $31,770 | $6,605 | $25,165 |
| 2020 | $2,307 | $31,780 | $6,610 | $25,170 |
| 2019 | $2,152 | $26,730 | $7,270 | $19,460 |
| 2018 | $2,126 | $26,730 | $7,270 | $19,460 |
| 2017 | $2,171 | $26,730 | $7,270 | $19,460 |
| 2016 | $2,109 | $26,730 | $7,270 | $19,460 |
| 2015 | $2,171 | $26,730 | $7,270 | $19,460 |
| 2014 | $2,042 | $26,730 | $7,270 | $19,460 |
| 2013 | $2,191 | $30,250 | $7,270 | $22,980 |
Source: Public Records
Map
Nearby Homes
- 307 Pauline Ave
- 2948 Trenton Rd
- 256 High Grove Blvd
- 0 Kreiner Ave
- 379 Stull Ave
- 412 Stevenson Ave
- 117 Kreiner Ave
- 440 Wirth Ave
- 47 Kreiner Ave
- 490 Stevenson Ave
- 2863 Burnside St
- 6 Kreiner Ave
- 5 Kreiner Ave
- 423 Stetler Ave
- 544 Dennison Ave
- 179 Davenport Ave
- 2528 Ogden Ave
- 48 Marion Ave
- V/L Marion Ave
- 2487 Delaware Ave
- 303 Ripley Ave
- 315 Ripley Ave
- 305 Ripley Ave
- 319 Ripley Ave
- 292 Pauline Ave
- 316 Ripley Ave
- 284 Pauline Ave
- 308 Ripley Ave
- 312 Ripley Ave
- 291 Ripley Ave
- 280 Pauline Ave
- 300 Ripley Ave
- 302 Pauline Ave
- 327 Ripley Ave
- 306 Pauline Ave
- 324 Ripley C-12 Ave
- 274 Pauline Ave
- 290 Ripley Ave
- 310 Pauline Ave
- 328 Ripley Ave