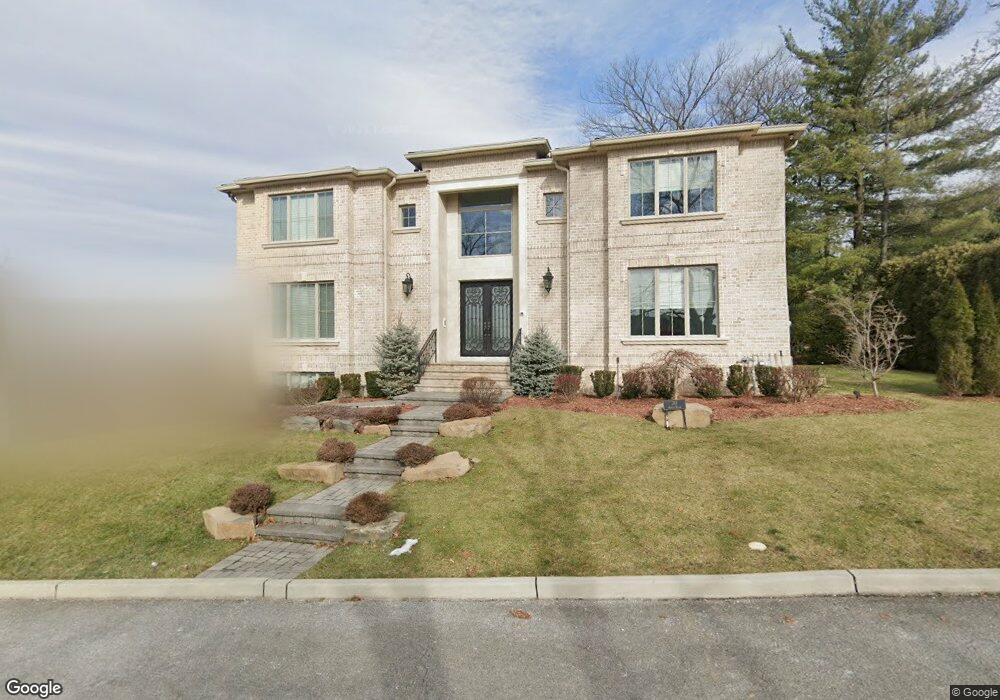
311 Ropes Rd Englewood Cliffs, NJ 07632
Estimated Value: $2,396,709 - $2,838,000
--
Bed
--
Bath
4,880
Sq Ft
$525/Sq Ft
Est. Value
About This Home
This home is located at 311 Ropes Rd, Englewood Cliffs, NJ 07632 and is currently estimated at $2,563,927, approximately $525 per square foot. 311 Ropes Rd is a home located in Bergen County with nearby schools including North Cliff Elementary School, Upper School Elementary School, and The Moriah School.
Ownership History
Date
Name
Owned For
Owner Type
Purchase Details
Closed on
May 27, 2016
Sold by
C & Y Development Lc
Bought by
Yoo Seongmin and Yoo Keith
Current Estimated Value
Home Financials for this Owner
Home Financials are based on the most recent Mortgage that was taken out on this home.
Original Mortgage
$950,000
Interest Rate
3.66%
Mortgage Type
New Conventional
Purchase Details
Closed on
Jul 2, 2014
Sold by
Chung Yon Boon and Chung Ruth
Bought by
C & Y Development Llc
Purchase Details
Closed on
Jun 8, 1998
Sold by
Cho Chung Kwang
Bought by
Chung Yon Boon
Home Financials for this Owner
Home Financials are based on the most recent Mortgage that was taken out on this home.
Original Mortgage
$300,000
Interest Rate
6.59%
Mortgage Type
Purchase Money Mortgage
Create a Home Valuation Report for This Property
The Home Valuation Report is an in-depth analysis detailing your home's value as well as a comparison with similar homes in the area
Home Values in the Area
Average Home Value in this Area
Purchase History
| Date | Buyer | Sale Price | Title Company |
|---|---|---|---|
| Yoo Seongmin | $2,000,000 | Westcor Land Title Insurance | |
| Yoo Seongmin | $2,000,000 | Attorney | |
| C & Y Development Llc | $735,000 | -- | |
| Chung Yon Boon | -- | -- | |
| Chung Yon Boon | $414,000 | -- |
Source: Public Records
Mortgage History
| Date | Status | Borrower | Loan Amount |
|---|---|---|---|
| Previous Owner | Yoo Seongmin | $950,000 | |
| Previous Owner | Chung Yon Boon | $300,000 |
Source: Public Records
Tax History Compared to Growth
Tax History
| Year | Tax Paid | Tax Assessment Tax Assessment Total Assessment is a certain percentage of the fair market value that is determined by local assessors to be the total taxable value of land and additions on the property. | Land | Improvement |
|---|---|---|---|---|
| 2025 | $22,672 | $1,962,900 | $619,700 | $1,343,200 |
| 2024 | $22,397 | $1,962,900 | $619,700 | $1,343,200 |
| 2023 | $22,043 | $1,962,900 | $619,700 | $1,343,200 |
| 2022 | $22,043 | $1,962,900 | $619,700 | $1,343,200 |
| 2021 | $16,912 | $1,962,900 | $619,700 | $1,343,200 |
| 2020 | $22,593 | $1,962,900 | $619,700 | $1,343,200 |
| 2019 | $21,219 | $1,962,900 | $619,700 | $1,343,200 |
| 2018 | $20,473 | $1,962,900 | $619,700 | $1,343,200 |
| 2017 | $19,590 | $1,962,900 | $619,700 | $1,343,200 |
| 2016 | $19,217 | $1,962,900 | $619,700 | $1,343,200 |
| 2015 | $7,574 | $814,400 | $619,700 | $194,700 |
| 2014 | $7,085 | $814,400 | $619,700 | $194,700 |
Source: Public Records
Map
Nearby Homes