Estimated Value: $161,000 - $177,000
3
Beds
2
Baths
1,503
Sq Ft
$114/Sq Ft
Est. Value
About This Home
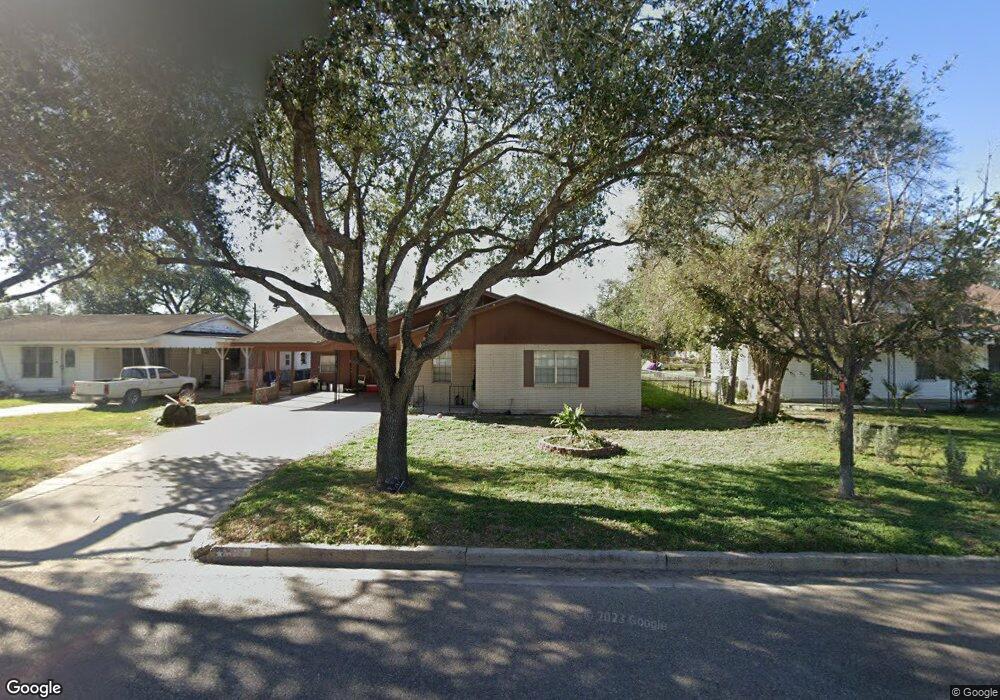
This home is located at 311 S 10th St, Donna, TX 78537 and is currently estimated at $170,654, approximately $113 per square foot. 311 S 10th St is a home located in Hidalgo County with nearby schools including A.M. Ochoa Elementary School, A.P. Solis Middle School, and Donna High School.
Ownership History
Date
Name
Owned For
Owner Type
Purchase Details
Closed on
Jan 15, 2019
Sold by
Caroza Thelma E
Bought by
Maldonado Sammantha Y and Maldonado Reyes
Current Estimated Value
Home Financials for this Owner
Home Financials are based on the most recent Mortgage that was taken out on this home.
Original Mortgage
$94,751
Outstanding Balance
$60,351
Interest Rate
4.5%
Mortgage Type
FHA
Estimated Equity
$110,303
Purchase Details
Closed on
May 11, 2013
Sold by
Espinoza Gonzalo R and Espinoza Ramona P
Bought by
Cardoza Thelma E
Create a Home Valuation Report for This Property
The Home Valuation Report is an in-depth analysis detailing your home's value as well as a comparison with similar homes in the area
Home Values in the Area
Average Home Value in this Area
Purchase History
| Date | Buyer | Sale Price | Title Company |
|---|---|---|---|
| Maldonado Sammantha Y | -- | Capital Title | |
| Cardoza Thelma E | -- | None Available |
Source: Public Records
Mortgage History
| Date | Status | Borrower | Loan Amount |
|---|---|---|---|
| Open | Maldonado Sammantha Y | $94,751 |
Source: Public Records
Tax History Compared to Growth
Tax History
| Year | Tax Paid | Tax Assessment Tax Assessment Total Assessment is a certain percentage of the fair market value that is determined by local assessors to be the total taxable value of land and additions on the property. | Land | Improvement |
|---|---|---|---|---|
| 2025 | $3,135 | $156,255 | $53,625 | $102,630 |
| 2024 | $3,135 | $156,656 | $31,125 | $125,531 |
| 2023 | $4,121 | $156,656 | $31,125 | $125,531 |
| 2022 | $3,738 | $134,867 | $24,375 | $110,492 |
| 2021 | $3,263 | $115,685 | $24,375 | $91,310 |
| 2020 | $2,101 | $72,000 | $24,000 | $48,000 |
| 2019 | $1,997 | $67,467 | $18,750 | $48,717 |
| 2018 | $2,001 | $67,467 | $18,750 | $48,717 |
| 2017 | $2,132 | $67,467 | $18,750 | $48,717 |
| 2016 | $1,666 | $52,711 | $11,250 | $41,461 |
| 2015 | $1,182 | $52,711 | $11,250 | $41,461 |
Source: Public Records
Map
Nearby Homes