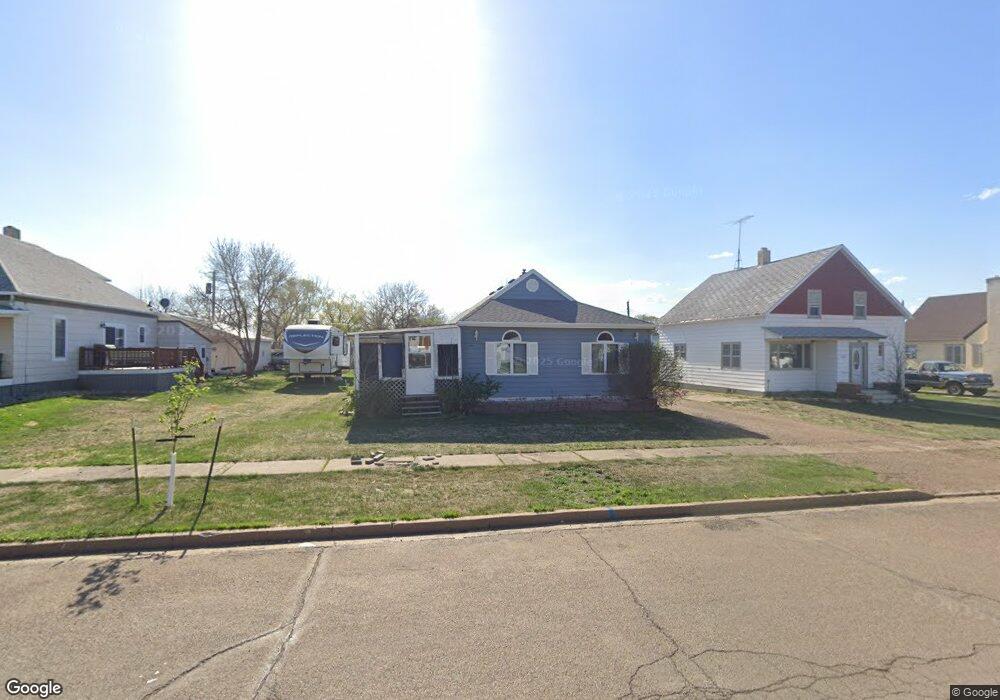
311 S 2nd St Glen Ullin, ND 58631
Estimated Value: $71,000 - $182,000
3
Beds
1
Bath
906
Sq Ft
$125/Sq Ft
Est. Value
About This Home
This home is located at 311 S 2nd St, Glen Ullin, ND 58631 and is currently estimated at $113,540, approximately $125 per square foot. 311 S 2nd St is a home located in Morton County with nearby schools including Glen Ullin Elementary School and Glen Ullin High School.
Ownership History
Date
Name
Owned For
Owner Type
Purchase Details
Closed on
May 23, 2025
Sold by
Ressler Becky and Ressler Travis
Bought by
Ressler Becky
Current Estimated Value
Home Financials for this Owner
Home Financials are based on the most recent Mortgage that was taken out on this home.
Original Mortgage
$100,000
Outstanding Balance
$99,658
Interest Rate
6.83%
Mortgage Type
New Conventional
Estimated Equity
$13,882
Purchase Details
Closed on
Dec 19, 2022
Sold by
Kirchmeier Kyle
Bought by
Ressler Becky and Fuhrmann Becky Jo
Purchase Details
Closed on
Oct 18, 2022
Sold by
Fuhrmann Ronald Duane
Bought by
Deutsche Bank National Trust Company and Ameriquest Mortgage Securities Inc
Purchase Details
Closed on
Aug 14, 2018
Sold by
Fuhrman Ronald and Fuhrman Becky J
Bought by
Wetzel Jordan P and Wetzel Nichole M
Create a Home Valuation Report for This Property
The Home Valuation Report is an in-depth analysis detailing your home's value as well as a comparison with similar homes in the area
Home Values in the Area
Average Home Value in this Area
Purchase History
| Date | Buyer | Sale Price | Title Company |
|---|---|---|---|
| Ressler Becky | -- | None Listed On Document | |
| Ressler Becky | $36,515 | -- | |
| Deutsche Bank National Trust Company | $36,515 | -- | |
| Wetzel Jordan P | -- | None Available |
Source: Public Records
Mortgage History
| Date | Status | Borrower | Loan Amount |
|---|---|---|---|
| Open | Ressler Becky | $100,000 |
Source: Public Records
Tax History Compared to Growth
Tax History
| Year | Tax Paid | Tax Assessment Tax Assessment Total Assessment is a certain percentage of the fair market value that is determined by local assessors to be the total taxable value of land and additions on the property. | Land | Improvement |
|---|---|---|---|---|
| 2024 | $536 | $34,800 | $2,850 | $31,950 |
| 2023 | $931 | $34,100 | $2,850 | $31,250 |
| 2022 | $938 | $35,400 | $1,950 | $33,450 |
| 2021 | $957 | $36,900 | $1,200 | $35,700 |
| 2020 | $968 | $36,700 | $1,200 | $35,500 |
| 2019 | $934 | $35,350 | $0 | $0 |
| 2018 | $933 | $33,950 | $1,600 | $32,350 |
| 2017 | $688 | $33,200 | $1,600 | $31,600 |
| 2016 | $633 | $30,600 | $1,600 | $29,000 |
| 2015 | $544 | $25,500 | $1,600 | $23,900 |
| 2014 | $459 | $23,400 | $1,550 | $21,850 |
| 2013 | $433 | $21,600 | $1,550 | $20,050 |
Source: Public Records
Map
Nearby Homes
- 212 Main St S
- 311 B St S
- 409 B St S
- 202 E St E
- 202 E St S
- 6044 41st St
- 7415 44th St
- 3660 County Road 89
- 3324 58th Ave
- 311 S Park St
- Tbd Gallagher's Subdivision
- 211 N Bismarck St
- 215 N East St
- 229 S Grove St
- 402 N East St
- 426 N East St
- 429 N East St
- 520 Washington Ave
- 65 Cabin Area 3
- 5475 Relaxation Ave