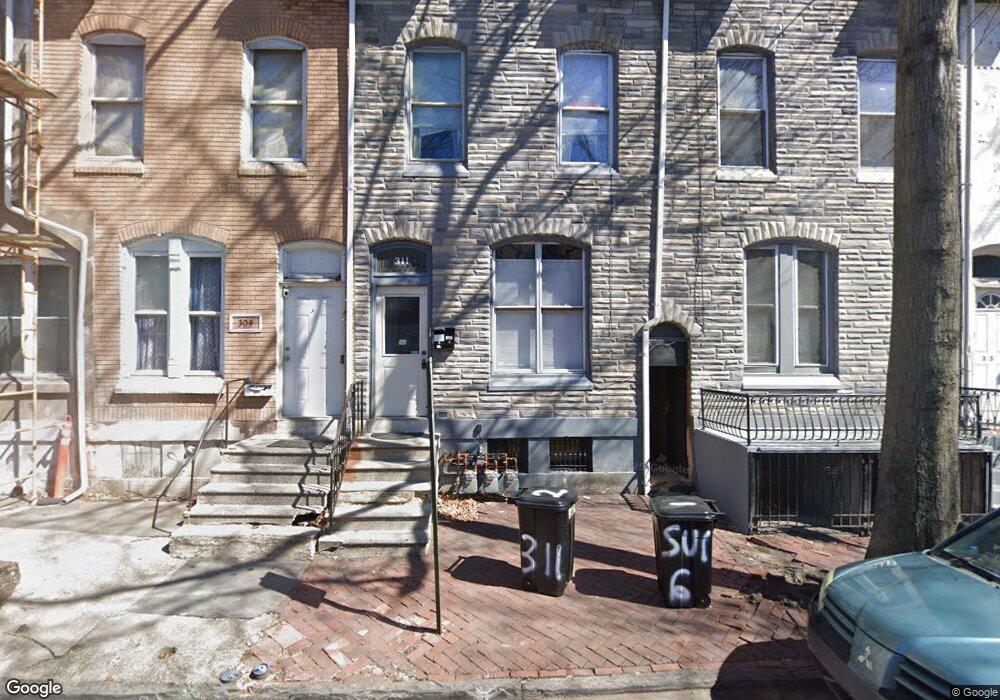
311 S 6th St Reading, PA 19602
Estimated Value: $87,000 - $188,000
5
Beds
1
Bath
1,981
Sq Ft
$73/Sq Ft
Est. Value
About This Home
This home is located at 311 S 6th St, Reading, PA 19602 and is currently estimated at $144,925, approximately $73 per square foot. 311 S 6th St is a home located in Berks County with nearby schools including Tyson-Schoener Elementary School, Southwest Middle School, and Reading Senior High School.
Ownership History
Date
Name
Owned For
Owner Type
Purchase Details
Closed on
Jan 31, 2020
Sold by
Casilla Yolanda M
Bought by
Casilla Llc
Current Estimated Value
Home Financials for this Owner
Home Financials are based on the most recent Mortgage that was taken out on this home.
Original Mortgage
$30,000
Outstanding Balance
$6,395
Interest Rate
3.7%
Mortgage Type
Future Advance Clause Open End Mortgage
Estimated Equity
$138,530
Create a Home Valuation Report for This Property
The Home Valuation Report is an in-depth analysis detailing your home's value as well as a comparison with similar homes in the area
Home Values in the Area
Average Home Value in this Area
Purchase History
| Date | Buyer | Sale Price | Title Company |
|---|---|---|---|
| Casilla Llc | $50,232 | Conestoga Title Company |
Source: Public Records
Mortgage History
| Date | Status | Borrower | Loan Amount |
|---|---|---|---|
| Open | Casilla Llc | $30,000 |
Source: Public Records
Tax History Compared to Growth
Tax History
| Year | Tax Paid | Tax Assessment Tax Assessment Total Assessment is a certain percentage of the fair market value that is determined by local assessors to be the total taxable value of land and additions on the property. | Land | Improvement |
|---|---|---|---|---|
| 2025 | $847 | $31,200 | $8,800 | $22,400 |
| 2024 | $1,385 | $31,200 | $8,800 | $22,400 |
| 2023 | $1,364 | $31,200 | $8,800 | $22,400 |
| 2022 | $1,364 | $31,200 | $8,800 | $22,400 |
| 2021 | $1,364 | $31,200 | $8,800 | $22,400 |
| 2020 | $1,350 | $31,200 | $8,800 | $22,400 |
| 2019 | $1,350 | $31,200 | $8,800 | $22,400 |
| 2018 | $1,350 | $31,200 | $8,800 | $22,400 |
| 2017 | $1,341 | $31,200 | $8,800 | $22,400 |
| 2016 | $766 | $31,200 | $8,800 | $22,400 |
| 2015 | $766 | $31,200 | $8,800 | $22,400 |
| 2014 | $705 | $31,200 | $8,800 | $22,400 |
Source: Public Records
Map
Nearby Homes
- 646 Bingaman St
- 529 Bingaman St
- 525 Bingaman St
- 737 Bingaman St
- 135 S 6th St
- 238 S 5th St
- 226 S 5th St
- 129 Lemon St
- 22 & 24 Neversink St
- 20 Neversink St
- 319 S 8th St
- 311 S 8th St
- 514 Laurel St
- 510 Laurel St
- 226 S 4th St
- 830 Bingaman St
- 730 Franklin St
- 464 Spring Garden St
- 323 Pine St
- 312 Carpenter St