Estimated Value: $53,000 - $97,000
2
Beds
2
Baths
1,364
Sq Ft
$57/Sq Ft
Est. Value
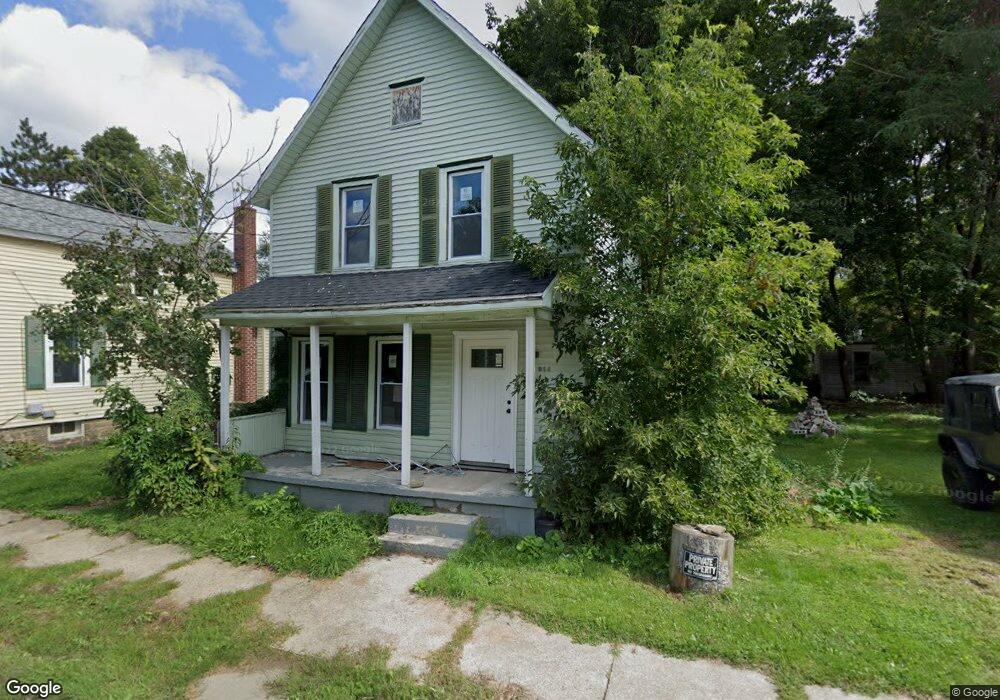
About This Home
This home is located at 311 S 7th St, Olean, NY 14760 and is currently estimated at $77,815, approximately $57 per square foot. 311 S 7th St is a home located in Cattaraugus County with nearby schools including Olean Intermediate-Middle School, Olean Senior High School, and Southern Tier Catholic School.
Ownership History
Date
Name
Owned For
Owner Type
Purchase Details
Closed on
Oct 20, 2023
Sold by
Gildersleeve James J Est and Phipps
Bought by
Singh Govinda and Singh Yuvraj
Current Estimated Value
Purchase Details
Closed on
Jul 13, 2018
Sold by
County Of Cattaraugus
Bought by
Gildersleeve James J
Purchase Details
Closed on
Jun 27, 2018
Sold by
County Of Cattaraugus
Bought by
Gildersleeve James J
Purchase Details
Closed on
May 22, 2018
Sold by
County Treasurer
Bought by
County Of Cattaraugus
Create a Home Valuation Report for This Property
The Home Valuation Report is an in-depth analysis detailing your home's value as well as a comparison with similar homes in the area
Home Values in the Area
Average Home Value in this Area
Purchase History
| Date | Buyer | Sale Price | Title Company |
|---|---|---|---|
| Singh Govinda | $16,000 | None Available | |
| Singh Govinda | $16,000 | None Available | |
| Gildersleeve James J | $5,600 | None Available | |
| Gildersleeve James J | $5,600 | None Available | |
| Gildersleeve James I | $5,600 | -- | |
| Gildersleeve James I | $5,600 | -- | |
| Gildersleeve James I | $5,600 | -- | |
| County Of Cattaraugus | -- | None Available |
Source: Public Records
Tax History
| Year | Tax Paid | Tax Assessment Tax Assessment Total Assessment is a certain percentage of the fair market value that is determined by local assessors to be the total taxable value of land and additions on the property. | Land | Improvement |
|---|---|---|---|---|
| 2025 | $1,802 | $28,500 | $3,000 | $25,500 |
| 2024 | $1,802 | $28,500 | $3,000 | $25,500 |
| 2023 | $1,073 | $28,500 | $3,000 | $25,500 |
| 2022 | $1,088 | $28,500 | $3,000 | $25,500 |
| 2021 | $1,120 | $28,500 | $3,000 | $25,500 |
| 2020 | $1,128 | $28,500 | $3,000 | $25,500 |
| 2019 | $624 | $28,500 | $3,000 | $25,500 |
| 2018 | $1,934 | $28,500 | $3,000 | $25,500 |
| 2017 | $1,247 | $28,500 | $3,000 | $25,500 |
| 2016 | $1,059 | $28,500 | $3,000 | $25,500 |
| 2015 | -- | $28,500 | $3,000 | $25,500 |
| 2014 | -- | $28,500 | $3,000 | $25,500 |
Source: Public Records
Map
Nearby Homes
Your Personal Tour Guide
Ask me questions while you tour the home.